
30
Jupyter to Medium Initial Post
I am very excited to announce the official release of jupyter_to_medium, a Python package that extends Jupyter Notebooks, allowing you to automate the process of publishing them as Medium blog posts.
I created a video showing exactly how to deploy a notebook as a Medium blog post.
I’ve published dozens of blog posts on Medium myself with all of them beginning as Jupyter Notebooks. Manually converting them to Medium posts was a fairly lengthy, painstaking process. One particularly painful process was inserting tables, which Medium does not support, into my posts. Nearly all of my posts contain numerous pandas DataFrames (such as this one, which has 40! DataFrames) which are represented as HTML tables within a notebook. I’d take screenshots of each one to insert them into my Medium posts.
jupyter_to_medium automates the process of converting Jupyter Notebooks to Medium blog posts allowing you to save a substantial amount of time.
Install from PyPI with the following command:
pip install jupyter\_to\_mediumAfter installation, fire up a Jupyter Notebook that you’d like to publish on Medium. Make sure you start a brand new notebook session. Even if you don’t have a notebook that is ready to publish, you can still test this extension and publish as a draft so that it remains private.
Once you open your notebook, head into the File menu and notice that you’ll have a new option Deploy as -> Medium Post.
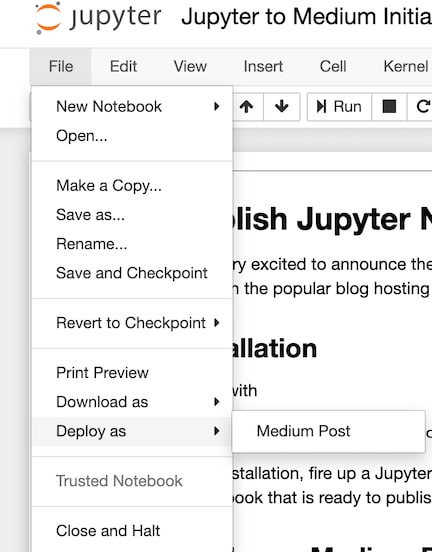
This new option should automatically show up in your notebook without doing anything. If it is missing, run the follow command to enable it.
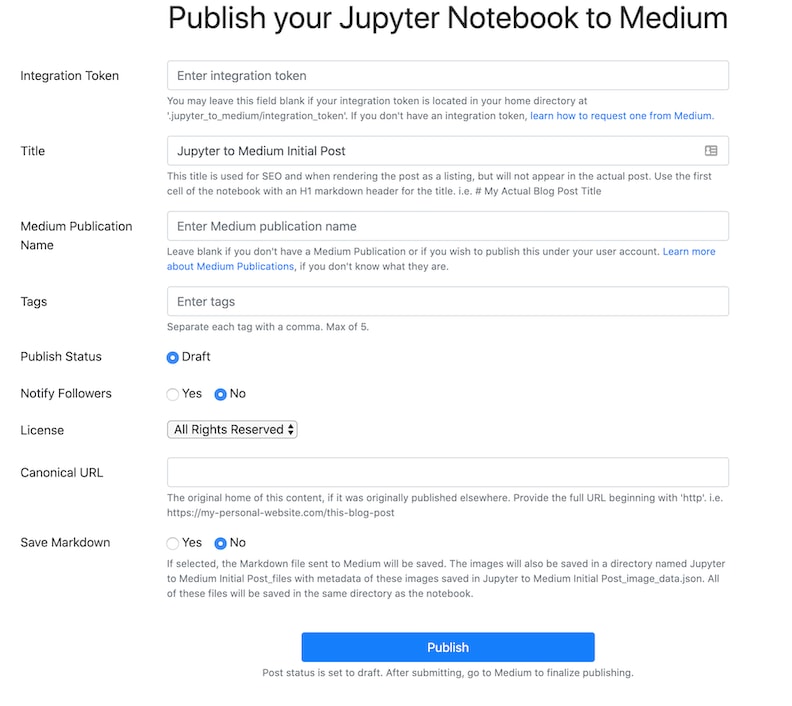
jupyter bundlerextension enable --py jupyter\_to\_medium.\_bundler --sys-prefixClicking on Deploy as -> Medium Post triggers a new browser tab with a short form that needs to be filled out before posting.
Before you can post to Medium, you’ll need to request an integration token from them. Do this by emailing them at [email protected]. Please read the entire instructions on how to get your integration token.
Once your request is granted, navigate to your Medium settings page. Towards the bottom of the page exists the section on Integration Tokens. Enter a description for the token (jupyter_to_medium is a good choice) and then create the token.
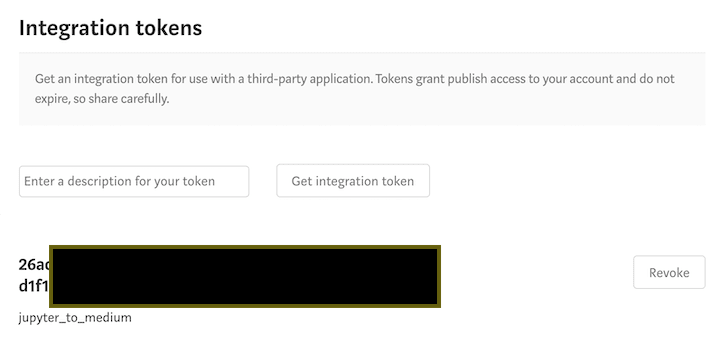
Once you have your integration token, create the folder and file .jupyter_to_medium/integration_token in your home directory and save the token there. If you don't save it, you'll need to access it every time you wish to make a new post.
Once you have your integration token, you can complete the rest of the form. Note that the ‘Title’ text box is not the actual title of the post, but a title that Medium uses for SEO purposes. Use an H1 Markdown header in the first cell of your notebook to create the actual title of your post.
Once you’ve completed the form, click the Publish button. At this time, only publishing as a ‘draft’ is allowed as you probably want to review what your post looks like before publishing it publicly.
If your post was successful, you’ll see the following screen with the URL of your post.

As stated, jupyter_to_medium only allows for publishing as a draft. To make your post public, go to your post on Medium and publish there.

There are several features that jupyter_to_medium provides to ensure that your notebook appears in the
All images in the Markdown cells, such as the five above are found and uploaded to Markdown. Medium limits the image types to png, jpeg, gif, and tiff.
Medium does not support tables, such as those produced in output cells by pandas DataFrames. As a workaround, these tables are uploaded as images captured by the Chrome browser’s screenshot ability. In the following code cell, the bar_chart_race package is used to import a pandas DataFrame containing deaths from COVID-19 in several countries. It is embedded in the Medium post as an image.
import bar\_chart\_race as bcr
df = bcr.load\_dataset('covid19')
df = df.iloc[-15:-10, ::3]
df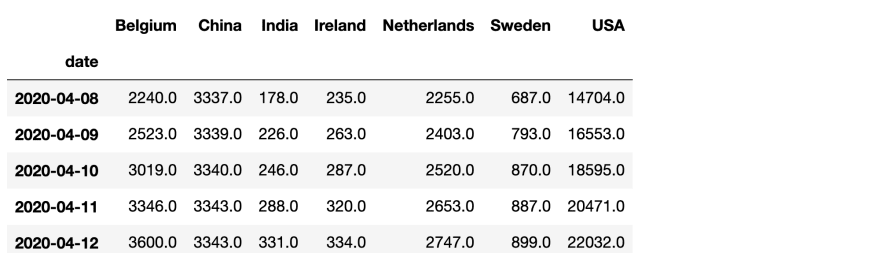
Styled pandas DataFrames are also embedded in your post as images.
df.style.highlight\_max()
All matplotlib plots, along with any other command that outputs an image will be safely embedded in your post.
import matplotlib.pyplot as plt
fig, ax = plt.subplots(figsize=(4, 2.5), dpi=144)
df.loc['2020-04-12'].sort\_values().plot(kind='barh', ax=ax, width=.8);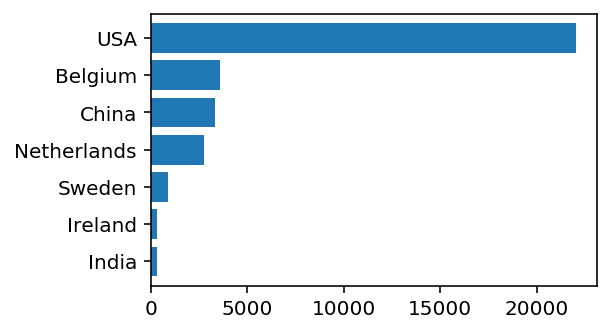
Even animated gifs are supported by Medium. This one created by the bar_chart_race function.
from IPython.display import Image
bcr.bar\_chart\_race(df, 'docs/images/covid19.gif', figsize=(4, 2.5))
Image(filename='docs/images/covid19.gif')
If you do use jupyter_to_medium, please mention in the post that you’ve used it, so that others can find out about it.
Immerse yourself in my comprehensive path for mastering data science and machine learning with Python. Purchase the All Access Pass to get lifetime access to all current and future courses. Some of the courses it contains:
30