
27
Python Data Visualization - Atlanta Crime Data (Part 2)
In part 1, we made a simple, 2 layer plot of Atlanta crime data in 2021. This was done by importing a CSV that the Atlanta police department updates weekly, a shapefile to represent Atlanta roads, and creating an axis plot instance. While we were able to create impressive graphics in about 25 lines of code, the data isn't revealing anything. Check out my notebook here.

Is there more crime this year than last? How can we intuitively use code to find the answers? Let's start by importing the 2020 crime data. Right off the bat, we can think about how our 2021 data is incomplete. It's currently September 9th, 2021 so we are just over 2/3rds of the way through the year.
A way to easily filter your table data is to set a new index. Naturally, your index with be an integer that increases by one. Here we are going to use the occur_date as each rows index. What we also need to do is convert the string into a type datetime. This allows us to filter out or data by date, easily.
df2020 = pd.read_csv("https://github.com/nicholasoxford/pythonViz/blob/main/2020-old.csv?raw=true")
df2020.index = pd.to_datetime(df2020["occur_date"])
df2020 = df2020[(df2020.index < "2020-09-10")]
df2020
If you are using google collab, which you should, you will see a printout of the data frame. If you comment out the filter line,
df2020 = df2020[(df2020.index < "2020-09-10")], you will see the entire scope of the file. You'll also notice it only goes to September 30th. The rest of the data is another CSV, titled CRIME-2020. In the read_csv line, switch out the file name at the end for the rest of the years data.Just like in part 1, we need to transform this data frame into a geoDataFrame using geoPandas. Now that we are moving along in our python career, let's create a reusable function. We could just copy and paste, but I have a feeling this isn't the last time we are going to need to transform the dataframe.
def dfGeoTransfer(df):
  return  gpd.GeoDataFrame(df2021, crs="EPSG:4326", geometry=[Point(xy) for xy in zip(df2021['long'], df2021['lat'])])

geo_df20 = dfGeoTransfer(df2020)
geo_df20
You can see we combined the two lines into a longer return statement. You could keep it two, I think it's up to you really. Don't shoot me. Finally, we set the return value of the function, a geoDataFrame, to a new variable called geo_df20.
Next, we need to filter our data for the longitude and latitude of our steet plot. We can't do the same plot.xlim trick we did last time. While we are creating this filtering method, I think we should create an all-encompassing method. Our goal with this function is that it takes a link to a CSV and returns a geoDataFrame with the proper filtering and transformation.
def prepareGeoDataFrame(url):
  df = pd.read_csv(url)
  df.index = pd.to_datetime(df["occur_date"])
  df = df[(df.index < "2020-09-10")]
  filter = df["long"] > -84.425
  filter2 = df["long"] < -84.35
  filter3 = df["lat"] > 33.745
  filter4 = df["lat"] <  33.813
  df = df[(filter) &(filter2) & (filter3) & (filter4)]
  return  gpd.GeoDataFrame(df, crs="EPSG:4326", geometry=[Point(xy) for xy in zip(df['long'], df['lat'])])
To do a quick spot check of the data let's put the plots side by side. There is a neat trick using plot axes instances where you define how many rows / columns and it returns an array of axes instances. I think the code just kinda makes sense.
Let's also pass in our 2021 data through our
prepareGeoDataFarame function. Making sure our data is structured the same will help going forward. Plus, now all we have to do is pass in a URL and the hard work is done for us. The keen-eyed among you will have noticed one issue with our code above. If we pass in 2021 data, we basically will get back nothing. I made a quick and easy if statement to handle this situation.
df.index = pd.to_datetime(df["occur_date"])
  if(df.index.max().year == 2020):
    df = df[(df.index < "2020-09-10")]
  if(df.index.max().year == 2021):
    df = df[(df.index < "2021-09-10")]
  filter = df["long"] > -84.425
I said before we can't use the xlim and ylim methods, this is because we will be plotting our graphs side by side. To do this we will start the same, except we will add two properties to our subplots. Rows and columns. Now subplots will return an array of axes instances. To be clear, we will use the same street map for both, just different csv's.
With our new function, prepareGeoDataFrame, all we need is:
street_map = gpd.read_file('/content/drive/MyDrive/GC_Roads/GC_RD_GA/Roads_Atlanta_GA.shp')
geo_df20 = prepareGeoDataFrame("https://github.com/nicholasoxford/pythonViz/blob/main/2020-old.csv?raw=true")
geo_df21 = prepareGeoDataFrame("https://github.com/nicholasoxford/pythonViz/blob/main/COBRA-2021%203.csv?raw=true")
fig, (ax1, ax2) = plt.subplots(nrows=1, ncols=2,figsize=(9,9))
#plot both streetmap and and long/lat points
# fig, ax = plt.subplots(figsize=(15,15))
geo_df21.plot(column="UC2_Literal", ax=ax1,alpha=0.5, legend=True,markersize=30)
street_map.to_crs(4326).plot(ax=ax1, alpha=0.4,color='grey')
geo_df20.plot(column="UC2_Literal", ax=ax2,alpha=0.5, legend=True,markersize=30)
street_map.to_crs(4326).plot(ax=ax2, alpha=0.4,color='grey')
fig.tight_layout()
and we get
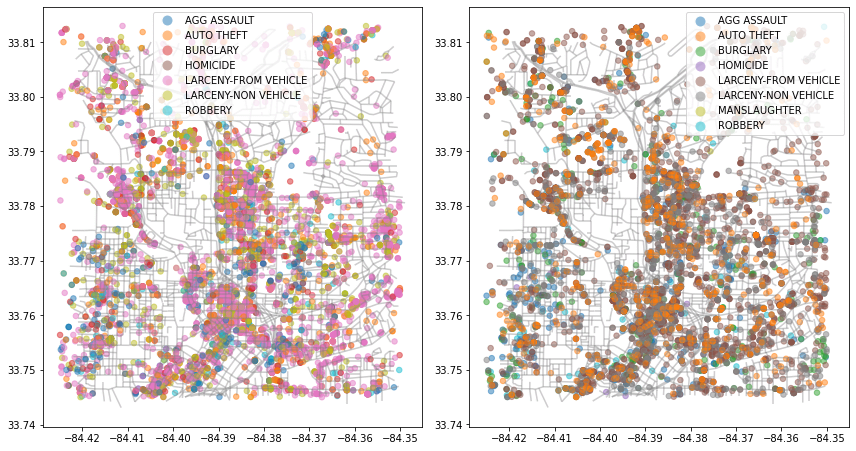
Clearly, this isn't ideal, the colors don't line up for example. However, we have simplified our code, and we have a multiple-column graph instance. You as a coder should also have a much better understanding of defining a function and if statements. Pandas and geoPandas makes it so easy. I feel like this would be almost impossible otherwise.
Check back in part 3 where we do statistical analysis and break it down by crime.
Nicholas Oxford
27