
34
Airbnb Properties in Australia
This time, I will explore the Airbnb dataset from 2021 obtained at insideairbnb.com for Australia. I'll visualise all the listings on the map using a great Python library Datashader, will use Metabase (an open-source BI tool) to answer questions like
The dataset has about 200k listings, 6.3M reviews, and 70M calendar bookings. The live dashboard is available here.
The data exploration setup is similar to the one I described in one of my previous posts "Data behind parking tickets in New York City". I will use
I assume that you have some basic understanding of containers, Docker and Compose, but if you don't, check out my previous post which explains everything in detail.
To import data into a Postgres database, let's create the following tables:
The analysed dataset (although it has great insights) is not ready to use out of the box. Some of the records cannot be imported into the database, that's why I will create a simple Python ETL flow, the purpose of which is to
Python script GIST that performs that ETL process is available here.
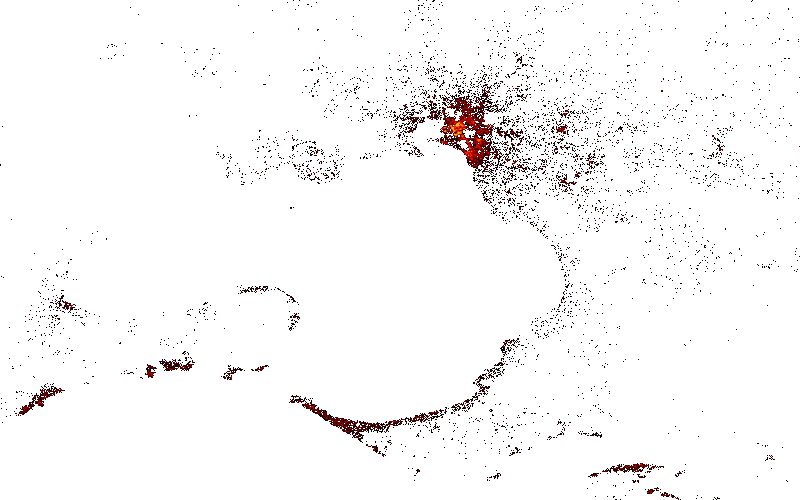
This is the first time I used this tool for visualising geodata, and it turned out to be quite good. The reason for choosing it was that it can easily plot big datasets with millions of points of data.
The basic setup is described in the official documentation, I just want to point out a few things
Let's first create a simple visualisation of all Airbnb listings across AU and NZ
import colorcet
import datashader as ds
import pandas as pd

df = pd.read_sql_table('listing', conn)
cvs = ds.Canvas(plot_width=800, plot_height=500)
agg = cvs.points(df, x='longitude', y='latitude')
img = ds.tf.shade(agg, cmap=colorcet.fire, how='log')
Now, let's visualise all the major cities separately. To do this, I will create a postgres view for each city, using its bounding geo coordinates. For example, a view for Melbourne can be created like that:
CREATE VIEW listing_melbourne AS
    SELECT *
    FROM listing
    WHERE (longitude BETWEEN 144.2589302195 AND 145.4866523875)
    AND  (latitude BETWEEN -38.517433861 AND -37.5733096779);
Then, I can ask Datashader to plot the entire
listing_melbourne table like that:df = pd.read_sql_table('listing_melbourne', conn)
cvs = ds.Canvas(plot_width=800, plot_height=500)
agg = cvs.points(df, x='longitude', y='latitude')
img = ds.tf.shade(agg, cmap=colorcet.fire, how='log')Melbourne
Similar to Melbourne, it's easy to create datashader plots for Sydney, Brisbane, Perth, Adelaide, etc.
Let's now turn to Metabase and build a few queries to address the questions at the beginning of that post.
What states have the most Airbnb listings
→ In Australia only
SELECT region_parent_name, COUNT(*) AS listing_count
FROM listing
WHERE region_parent_name IN ('New South Wales', 'Victoria','Queensland','Western Australia','South Australia','Tasmania','Australian Capital Territory', 'Northern Territory')
GROUP BY region_parent_name
ORDER BY listing_count DESC
→ In Australia and New Zealand
SELECT region_parent_name as region, COUNT(*) AS listing_count
FROM listing
WHERE region_parent_name IN ('New South Wales', 'Victoria','Queensland','Western Australia','South Australia','Tasmania','Australian Capital Territory', 'Northern Territory')
GROUP BY region_parent_name

UNION ALL

SELECT 'New Zealand' as region, COUNT(*) AS listing_count
FROM listing
WHERE region_parent_name NOT IN ('New South Wales', 'Victoria','Queensland','Western Australia','South Australia','Tasmania','Australian Capital Territory', 'Northern Territory')

ORDER BY listing_count DESC
What neighbourhoods are the most popular Airbnb destinations in Australia?
To answer this question, I can use one of the following columns in the listing table:
neighbourhood, host_neighbourhood, host_location. The problem here is that a lot of these columns have NULL or empty values. For example: SELECT COUNT(*) FROM "listing" where "neighbourhood" !='' will only return 124,363 rows, or 64% of all the listings. Coalescing these three fields also won't work properly.Instead, I will use geodata (lat, long) of the listings, and shapefiles from the Australian Bureau of Statistics to upload the suburb shapes into our database. There are several ways to upload .shp files into Postgres, but I recommend QGIS for that for its simplicity.
After uploading suburbs geodata into the new table
suburbs, I will run the following query:SELECT
suburbs.sa3_name21 AS suburb_name,
COUNT(listing.*) AS listing_count
FROM listing
JOIN suburbs
ON ST_Contains(ST_SetSRID(
suburbs.geom::GEOMETRY,
7844
), ST_SetSRID(ST_MakePoint(listing.longitude, listing.latitude), 7844))
GROUP BY suburb_name
ORDER BY listing_count DESCwhich gives us suburbs with the highest number of Airbnb listings:
or as a table:
Distribution by the number of bedrooms doesn't look unexpected:
SELECT bedrooms, COUNT(*) AS listing_count
FROM airdata.listing
WHERE bedrooms>0 AND bedrooms<15
GROUP BY bedrooms
ORDER BY listing_count DESC
How many rental properties are there per host?
WITH count_by_host AS (
SELECT host_id, COUNT(*) AS listing_count
FROM airdata.listing
GROUP BY host_id
)
SELECT listing_count, COUNT(count_by_host.host_id) as host_count
FROM count_by_host
GROUP BY listing_count
ORDER BY listing_count DESC
Some additional interesting findings:
One of the most interesting questions to address is the number of listings still available for Xmas 2021 period, per particular destination, i.e. what percentage of, say, Bondi Beach properties is available.
To find the answer, we need to use our
calendar table, which has an enormous 70M records. The queries will be running for some time, so it's a good thing to increase statement timeout in the Postgres settings.So, for example for Bondi Beach (
id=372) we have:WITH suburb_listings AS (
SELECT lst.id as lstid FROM "airdata"."listing" AS lst
JOIN "airdata"."suburbs" AS subs
ON ST_Contains(ST_SetSRID(
subs.geom::GEOMETRY,
7844
), ST_SetSRID(ST_MakePoint(lst.longitude, lst.latitude), 7844))
WHERE subs.id = 372
)
SELECT DISTINCT(cal.listing_id) FROM "airdata"."calendar" AS cal
WHERE cal.listing_id IN (SELECT lstid FROM suburb_listings)
AND (cal.date BETWEEN '2021-12-20 00:00:00+00' AND '2021-12-28 00:00:00+00')
AND cal.available=TRUEThe result is
347 listings. So out of 2350 total listings in Bondi Beach area, only 347 (< 15%) have some availability during the Christmas period. Let's try to visualise it as a chart. In order to do that, I will iterate the above query over all suburbs in the suburbs table, and visualise like that:Keep in mind, the above is based on the booking data as of April 2021.
In this article, we've done the following things
Thank you!
34