49
Get Prometheus Metrics from a Express.js app
I use Prometheus all the time for metrics and alert monitoring in Kubernetes. I decided to see how to setup monitoring in a Node/Express.js app. A quick search of npmjs and I found these two package prom-client a really detailed Prometheus client and express-prom-bundle which uses
prom-client under the hood, I choose express-prom-bundle as it was a quick win and was producing metrics with a few lines of code, my repo is here. I installed the following packages in my express appnpm install prom-client express-prom-bundle --saveThen added the Prometheus middleware to all routes
const express = require('express');
const app = express();
const promBundle = require("express-prom-bundle");

// Add the options to the prometheus middleware most option are for http_request_duration_seconds histogram metric
const metricsMiddleware = promBundle({
    includeMethod: true,
    includePath: true,
    includeStatusCode: true,
    includeUp: true,
    customLabels: {project_name: 'hello_world', project_type: 'test_metrics_labels'},
    promClient: {
        collectDefaultMetrics: {
        }
      }
});
// add the prometheus middleware to all routes
app.use(metricsMiddleware)

// default endpoint
app.get("/",(req,res) => res.json({
    "GET /": "All Routes",
    "GET /hello": "{hello:world}",
    "GET /metrics": "Metrics data",
    "POST /bye": "POST Request: + post data"
}));
// hello world rest endpoint
app.get("/hello", (req,res) => res.json({hello:"world"}));
app.post("/bye", (req,res) => res.send("POST Request : "+ req));

app.listen(8080, function () {
    console.log('Listening at http://localhost:8080');
  });
Running the app
npm start
> [email protected] start /home/austincunningham/repo/express-prometheus
> node index.js

Listening at http://localhost:8080

# curl the hello world endpoint
curl localhost:8080/hello
{"hello":"world"}%

# curl the metrics endpoint
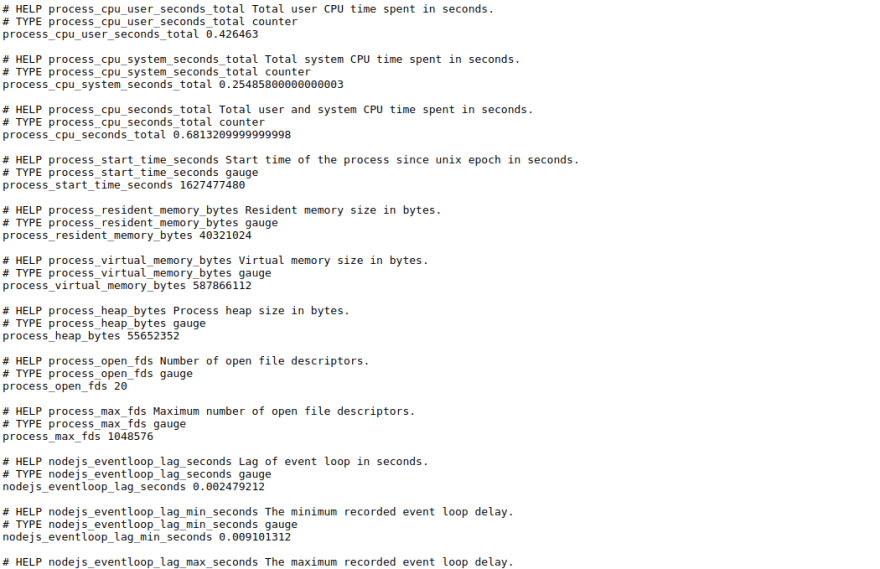
curl localhost:8080/metrics
# HELP process_cpu_user_seconds_total Total user CPU time spent in seconds.
# TYPE process_cpu_user_seconds_total counter
process_cpu_user_seconds_total 0.120868
# I cut the metrics output short here as its a lot of text but you get the ideaI am using crc which is local Kubernetes development environment based on Red Hat Openshift. I create a container for the app based on the following DockerFile
# syntax=docker/dockerfile:1

FROM node:12.18.1

WORKDIR /app

COPY ["package.json", "package-lock.json*", "./"]

RUN npm install

COPY . .

CMD [ "node", "index.js" ]
I then build, test the image locally and push the image
docker build -t quay.io/austincunningham/express-prometheus:v1.0.0 .
docker run -p 8080:8080 quay.io/austincunningham/express-prometheus:v1.0.0
Listening at http://localhost:8080
docker push quay.io/austincunningham/express-prometheus:v1.0.0
I can then deploy this on crc/openshift with the following two files
deployment.yaml
deployment.yaml
apiVersion: apps/v1
kind: Deployment
metadata:
  name: example-app
spec:
  replicas: 3
  selector:
    matchLabels:
      app: example-app
  template:
    metadata:
      labels:
        app: example-app
    spec:
      containers:
      - name: example-app
        image: quay.io/austincunningham/express-prometheus:v1.0.0
        ports:
        - name: web
          containerPort: 8080
service.yaml
kind: Service
apiVersion: v1
metadata:
  name: example-app
  labels:
    app: example-app #--> this is used for scraping the service via the serviceMonitor
spec:
  selector:
    app: example-app
  ports:
  - name: web
    port: 8080
Apply the files to the default project
oc project default
oc apply -f deployment.yaml
oc apply -f service.yaml
service/example-app created
# create a route to the service so you can access from the browser
oc expose service example-app
route.route.openshift.io/example-app exposedI am following the prometheus operator getting started guide. Applied the bundle from the setup on the default namespace
oc project default
oc apply -f https://raw.githubusercontent.com/prometheus-operator/prometheus-operator/master/bundle.yamlNOTE: Hit a issue where the prometheus-operator pod was in a crash loop backoff :(
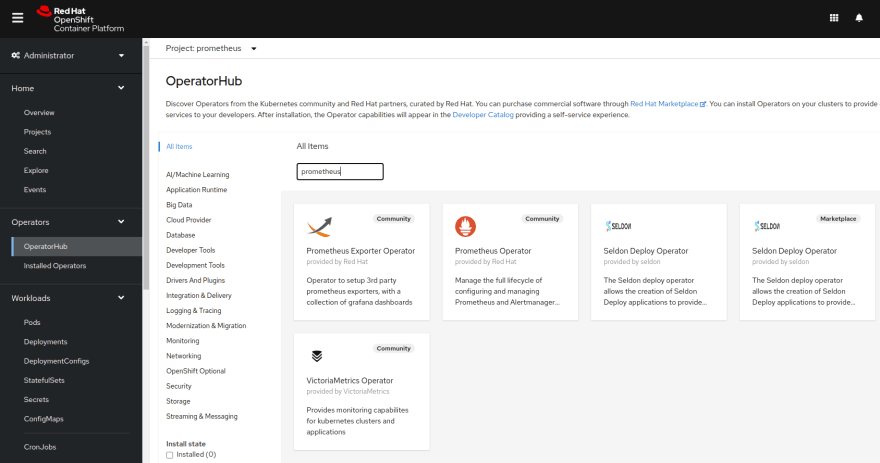
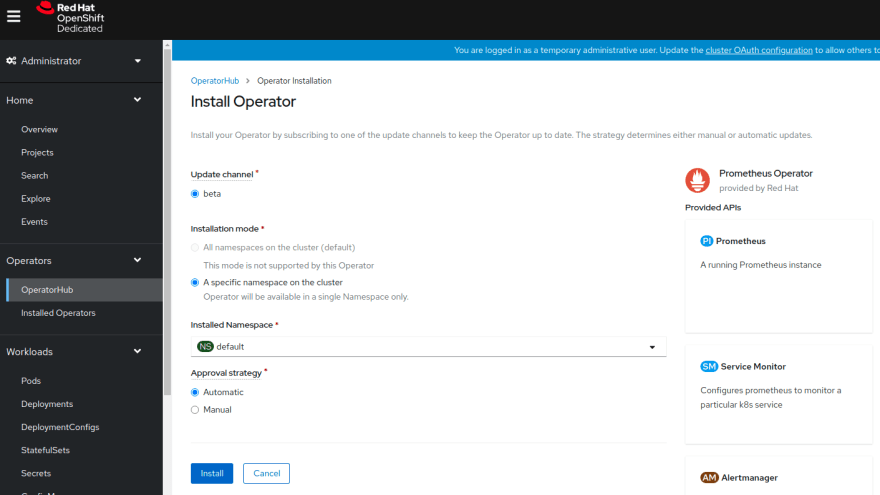
Openshift has an operator hub so I did the following to fix the crashing operator pod. First I deleted the existing prometheus-operator deployment
oc delete deployment prometheus-operatorPhew! that took longer to explain that to do.
First we add the Prometheus CR(custom resource) to the default namespace to start the Prometheus instance
prometheus.yaml
prometheus.yaml
apiVersion: monitoring.coreos.com/v1
kind: Prometheus
metadata:
  name: prometheus
spec:
  serviceAccountName: prometheus
  serviceMonitorSelector:
    matchLabels:
      team: frontend # --> this is used by prometheus to scrape the serviceMonitor
  resources:
    requests:
      memory: 400Mi
  enableAdminAPI: false
And add the service
prometheus-service.yaml
prometheus-service.yaml
kind: Service
apiVersion: v1
metadata:
  name: prometheus-operated
  namespace: default
  labels:
    operated-prometheus: 'true'
spec:
  ports:
    - name: web
      protocol: TCP
      port: 9090
      targetPort: web
  selector:
    app: prometheus
Apply the files and create a route
oc apply -f prometheus.yaml
oc apply -f prometheus-service.yaml
oc expose service prometheus-operated
The way Prometheus scrapes metrics is that it uses a service monitor to check a
service for a particular label. We have already created the service when we deployed the example-app with the label app: example-app in metadata.labels.Next we create a serviceMonitor in the default namespace and with a
service-monitor.yaml
selector for the app: example-app label. So we create the following file.service-monitor.yaml
apiVersion: monitoring.coreos.com/v1
kind: ServiceMonitor
metadata:
  name: example-app
  labels:
    team: frontend # --> this should match the serviceMonitorSelector in the prometheus CR
spec:
  selector:
    matchLabels:
      app: example-app # --> this should match the label in the service in example-app
  endpoints:
  - port: web
NOTE metadata.labels team: frontend we will use this later.
We upload the service-monitor.yaml file to the default namespace to create the serviceMonitor
oc apply -f service-monitor.yamlIn the prometheus.yaml CR we have already selected the service monitor this is done via
serviceMonitorSelector label with the label team: frontend Finally we need some RBAC rules which is Kubernetes version of permissions to allow Prometheus to see everything
Setup a service account, clusterRole and clusterRoleBinding. Create the following files
service-account.yaml
service-account.yaml
apiVersion: v1
kind: ServiceAccount
metadata:
  name: prometheus
clusterRole.yaml
apiVersion: rbac.authorization.k8s.io/v1
kind: ClusterRole
metadata:
  name: prometheus
rules:
- apiGroups: [""]
  resources:
  - nodes
  - nodes/metrics
  - services
  - endpoints
  - pods
  verbs: ["get", "list", "watch"]
- apiGroups: [""]
  resources:
  - configmaps
  verbs: ["get"]
- apiGroups:
  - networking.k8s.io
  resources:
  - ingresses
  verbs: ["get", "list", "watch"]
- nonResourceURLs: ["/metrics"]
  verbs: ["get"]
clusterRoleBinding.yaml
apiVersion: rbac.authorization.k8s.io/v1
kind: ClusterRoleBinding
metadata:
  name: prometheus
roleRef:
  apiGroup: rbac.authorization.k8s.io
  kind: ClusterRole
  name: prometheus
subjects:
- kind: ServiceAccount
  name: prometheus
  namespace: default
Apply the files to the default namespace
oc apply -f service-account.yaml
oc apply -f clusterRole.yaml
oc apply -f clusterRoleBinding.yaml
You should be able to access the route the default namespace
oc get routes
NAME          HOST/PORT                              PATH   SERVICES      PORT   TERMINATION   WILDCARD
example-app   example-app-default.apps-crc.testing          example-app   web                  None
prometheus prometheus-default.apps-crc.testing prometheus web NoneNOTE: be patient it can take a while to show up
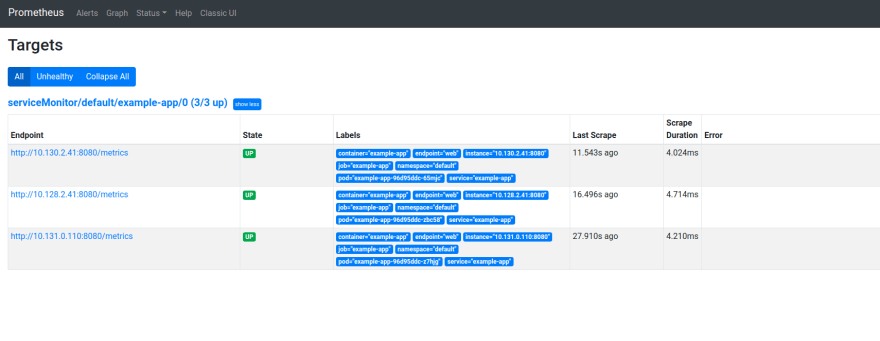
Then check the
Status\Targets should see the following targets up
That it I may do a follow up on setting up Grafana to use these metrics
49


