
33
Exploratory Data Analysis Using Python

Exploratory data analysis is one of the most important step for any data science project. In today's session we will be performing data analysis of titanic dataset. To do so, we will be using the Pandas, Seaborn and Matplotlib library. You can download the dataset from Kaggle here.
According to wikipedia:
"Exploratory data analysis, EDA is an approach to analyzing data sets to summarize their main characteristics, often with visual methods. A statistical model can be used or not, but primarily exploratory data analysis is for seeing what the data can tell us beyond the formal modelling or hypothesis testing task."
Exploratory data analysis in Python uses data visualisation to draw meaningful patterns and insights. It also involves the preparation of data sets for analysis by removing irregularities in the data.
Note That:
If EDA is not done properly then it can hamper the further steps in the machine learning model building process.
If done well, it may improve the efficiency of everything we do next.
This is the very first step of Exploratory Data Analysis. Data Sourcing is the process of finding and loading the data into our system.
1). Private Data
2). Public Data
Private Data.
As the name suggests, private data is given by private organisations. There are some security and privacy concerns attached to it. This type of data is used for mainly organisations internal analysis.
As the name suggests, private data is given by private organisations. There are some security and privacy concerns attached to it. This type of data is used for mainly organisations internal analysis.
Public Data.
This type of Data is available to everyone. We can find this in government websites and public organizations etc. Anyone can access this data, we do not need any special permissions or approval.
This type of Data is available to everyone. We can find this in government websites and public organizations etc. Anyone can access this data, we do not need any special permissions or approval.
Famous Sources of Public Data:
As i mentioned earlier i will using public data set from kaggle which can be obtained from this link.
Let try to understand the dataset first. It has 12 columns and we will be using 11 features to predict the target variable which is ‘Survived’.
The target variable is the one which we are trying to predict. Our first step would be to polish the features so that it can be used to input to a machine learning model which we can use to do our required task.
To load the data into a dataframe we can use:
url = 'https://raw.githubusercontent.com/Data-Science-East-AFrica/Exploratory-Data-Analysis-Using-Python/main/train.csv'
train=pd.read_csv(url)
To get idea about the dataset we can use the head function of the dataframe. It will return the first 5 rows. So executing the train.head() will give us the first 5 rows as shown below.

Similarly we can use the info and describe method to get detailed statistics about the data.
One of the important objective data preprocessing and eda is to get rid of the null data. To do so we need to know where we have got null values. We shall use heatmap inorder to have an idea on this. To implement it seaborn library will be used. The following code snippet will create a heatmap for it.
sns.heatmap(train.isnull(),yticklabels=False,cbar=False,cmap=’viridis’)The output of the above code would be as shown below:

As we can see from the diagram above the column ‘Age’ and ‘Cabin’ have got null values. While ‘Cabin’ has huge amount null values, ‘Age’ has moderate amount of null values.
Here we would drop the ‘Cabin’ column as it has got mostly NULL values.
To do so we will use the following code snippet.
train.drop(‘Cabin’,axis=1,inplace=True)Now comes the interesting part. We need to form a logic to impute the missing values of the ‘Age’ column. We shall come back to it later after understanding the relation between ‘Age’ and various other variables.
Let us try to know if the dependent variable ‘Survived’ has any relation with the variable ‘Sex’.
To do so we would use factorplot. The following code snippet would return us the required figure.
sns.factorplot(x=’Survived’,col=’Sex’,kind=’count’,data=train)The output of the above code is the following figure:

Inference: As we all know from the movie as well as the story of titanic females were given priority while saving passengers. The above graph also tells us the same story. More number of male passengers have died than female ones.
Similarly let us try to see how the variable ‘Pclass’ is related to the variable ‘Survived’.
To do so we would draw a countplot using the following code snippet.
sns.countplot(x=’Survived’,hue=’Pclass’,data=train)The output of the above code is the following figure:

Inference: The graph tells us that Pclass 3 were more likely to be survived. It was meant for the richer people while Pclass 1 were the most likely victims which was relatively cheaper than class 3.
Let us try to understand the column ‘Sibsip’ in detail. To do so we would again use the countplot from seaborn. The following code snippet would achieve the same.
sns.countplot(x=’SibSp’,data=train)The output of the above code is:
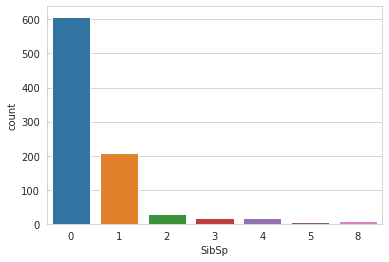
Inference: Here ‘SibSp’ variable refers to the number of sibling or spouse the person was accompanied with. We can see most of the people came alone.
Lastly we have to figure out a way to fill the missing value of the variable ‘Age’. Here we segregated the ‘Age’ variable according to the Pclass variable as it was found out that ‘Age’ and ‘Pclass’ column were related.
We would draw a boxplot that would tell us the mean value each of the Pclass. To do so we can write the following code snippet.
sns.boxplot(x='Pclass',y='Age',data=train,palette='winter')It would produce this graph:

From this graph we can find out the mean age for each of the Pclass.
We would impute the same for missing ‘Age’ values. We can write a simple python function to get the same.
We would impute the same for missing ‘Age’ values. We can write a simple python function to get the same.
Dealing With The Categorical Value:
We have to convert the categorical values into numbers so that it can be used as an input to the model. To do so we would use the following code snippet.
embark=pd.get_dummies(train[‘Embarked’],drop_first=True) sex=pd.get_dummies(train[‘Sex’],drop_first=True)Similarly we have to drop all the columns that do not provide any meaningful information like ‘Name’ and ‘Ticket’ along with the previous ‘Embarked’ and ‘Sex’ as they have been replaced. Also we need add the newly created embark and sex column.
train.drop(['Sex','Embarked','Name','Ticket'],axis=1,inplace=True)

train=pd.concat([train,sex,embark],axis=1)
Congratulations , now our dataset is ready to be used as input to a machine learning model. This was a detailed analysis of the titanic dataset.
You Can get the code full code here:
Google Colabs:
Git Hub:
More Resources on Data Analysis Using Python:
https://github.com/LuxTechAcademy/Data-Cleaning-with-Python-and-Pandas
https://github.com/LuxTechAcademy/Data-Cleaning-with-Python-and-Pandas
To get connected with me in twitter go to this link: https://twitter.com/HarunMbaabu
33