
29
Getting started with Azure Data Explorer and Azure Synapse Analytics for Big Data processing
With practical examples, learn how to leverage integration between these services for processing data with Apache Spark
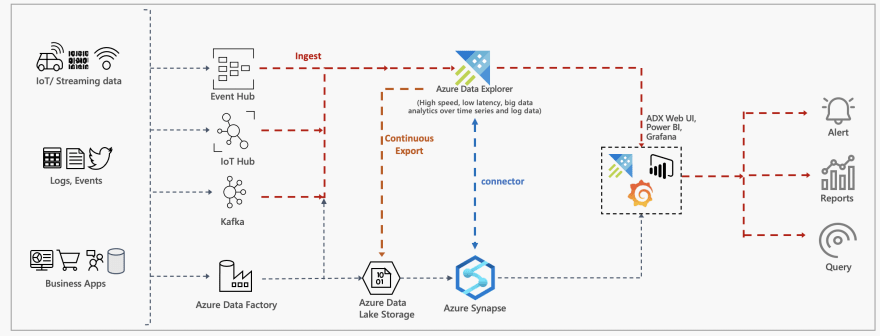
Thanks to an extension to this solution, Azure Data Explorer is available as a Linked Service in Azure Synapse Analytics, allowing seamless integration between Azure Data Explorer and Apache Spark pools in Azure Synapse.
This blog post is a getting started guide to demonstrate the integration between Azure Data Explorer and Azure Synapse. It covers:
How to process existing data in Azure Data Explorer using Spark and Azure Synapse.
Process streaming and batch data using Spark and write it back to Azure data explore.
Notebooks are available in this GitHub repo — https://github.com/abhirockzz/synapse-azure-data-explorer-101
To learn along, all you need is an Azure account (you can get one for free). Move on to the next section once you’re ready!
Start by creating an Azure Synapse workspace along with an Apache Spark pool. Then, Create an Azure Data Explorer cluster and database
During the ingestion process, Azure Data Explorer attempts to optimise for throughput by batching small ingress data chunks together as they await ingestion — this is governed by the IngestionBatching policy. The default policy values are: 5 minutes as the maximum delay time, 1000 items and total size of 1G for batching. What this means that there is a certain amount of delay between when the data ingestion is triggered, until it is ready for querying. The good thing is that, the policy can be fine tuned as per requirements.
For the purposes of this demo, we focus on getting our data available for query as soon as possible. Hence, you should update the policy by using MaximumBatchingTimeSpan value of 30 seconds
.alter database adxdb policy ingestionbatching @'{"MaximumBatchingTimeSpan": "00:00:30"}'The impact of setting this policy to a very small value is an increased cost and reduced performance — this is just for demo purposes
In Azure Synapse Analytics, a Linked Service is where you define your connection information to other services. You can create a linked service for Azure Data Explorer using the Azure Synapse Analytics workspace.
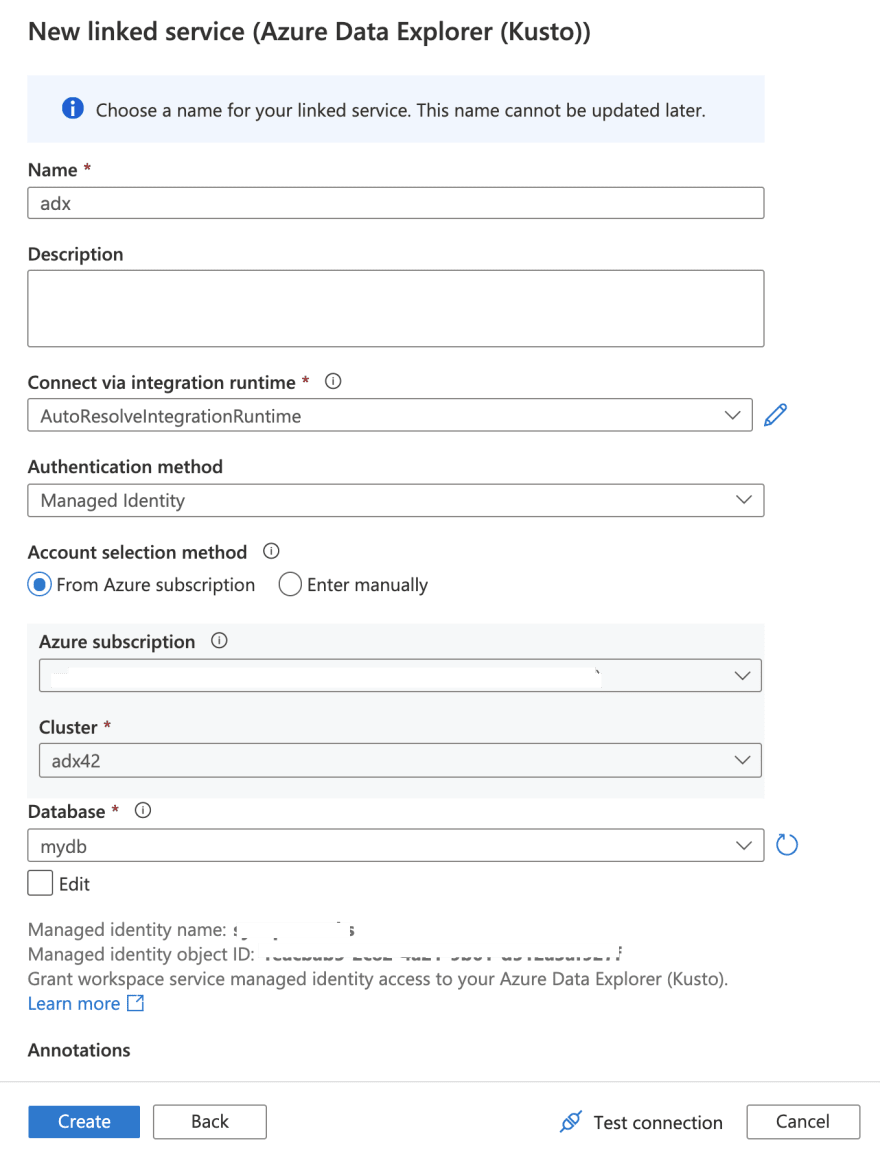
Managed Identity is being used as the Authentication Method as opposed to Service Principals
After you create the Linked Service, it will show up in the list:
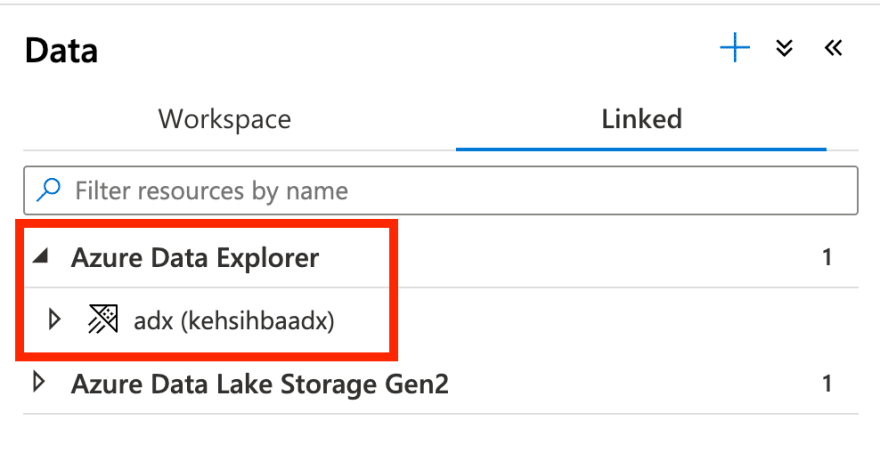
Ok you are all set!
If you’re already using Azure Data Explorer, it’s likely that you have a lot of data sitting there, ready to be processed! So let’s start off by exploring this aspect.
Data Ingestion is key component for a Big Data Analytics services such as Azure Data Explorer. No wonder, it supports a plethora of ways using which you can pull in data from a variety of sources. Although a detailed discussion of ingestion techniques and options, you are welcome to read about it in the documentation.
In the interest of time, let’s ingest data manually. Don’t let the word “manually” mislead you. It’s quite simple and fast!
Start by creating a table (let’s call it StormEvents_1) in the database:
.create table StormEvents_1 (StartTime: datetime, EndTime: datetime, EpisodeId: int, EventId: int, State: string, EventType: string, InjuriesDirect: int, InjuriesIndirect: int, DeathsDirect: int, DeathsIndirect: int, DamageProperty: int, DamageCrops: int, Source: string, BeginLocation: string, EndLocation: string, BeginLat: real, BeginLon: real, EndLat: real, EndLon: real, EpisodeNarrative: string, EventNarrative: string, StormSummary: dynamic)… and ingest CSV data into the table (directly from Blob storage):
.ingest into table StormEvents_1 'https://kustosamplefiles.blob.core.windows.net/samplefiles/StormEvents.csv?sv=2019-12-12&ss=b&srt=o&sp=r&se=2022-09-05T02:23:52Z&st=2020-09-04T18:23:52Z&spr=https&sig=VrOfQMT1gUrHltJ8uhjYcCequEcfhjyyMX%2FSc3xsCy4%3D' with (ignoreFirstRecord=true)If you found this technique useful, I encourage you to try out one-click ingestion as well!
It might take a minute or so for ingestion to complete. Confirm if data is available and execute simple queries:
.show ingestion failures
StormEvents_1| count
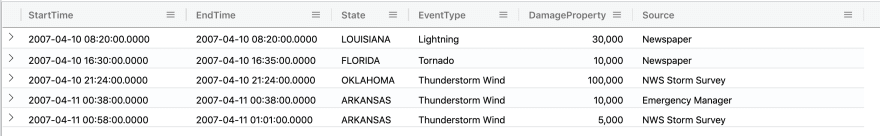
StormEvents_1| take 5
StormEvents_1| take 5 | project StartTime, EndTime, State, EventType, DamageProperty, SourceThe StormEvents_1 table provides some information about storms that happened in the United States. It looks like this:
For the subsequent steps, you can either paste the code directly into a Synapse Studio notebook in Azure Synapse Analytics or import this notebook into the workspace.

Start off with something simple:
kustoDf  = spark.read \
            .format("com.microsoft.kusto.spark.synapse.datasource") \
            .option("spark.synapse.linkedService", "adx") \
            .option("kustoDatabase", "adxdb") \
            .option("kustoQuery", "StormEvents_1 | take 10") \
            .load()

display(kustoDf)
To read data from Azure Data Explorer, we need to specify thequery using the kustoQuery option. In this case, we are simply executing StormEvents_1 | take 10 to validate the data.
Let’s try another Kusto query this time:
filtered_df = spark.read \
.format("com.microsoft.kusto.spark.synapse.datasource") \
.option("spark.synapse.linkedService", "AzureDataExplorer1") \
.option("kustoDatabase", "mydb") \
.option("kustoQuery", "StormEvents_1 | where DamageProperty > 0 and DeathsDirect > 0 | project EventId, State, StartTime, EndTime, EventType, DamageProperty, DeathsDirect, Source") \
.load()

filtered_df.createOrReplaceTempView("storm_dataset")
This will read all the records into a DataFrame, select the relevant columns and filter the data. For example, we are excluding events where there has not been any property damage or deaths. Finally, we create a temporary view (storm_dataset) in order to perform further data exploration using Apache Spark SQL.
Before that, lets use Seaborn (a Python data visualisation library) to draw a simple bar plot:
import seaborn as sns
import matplotlib.pyplot as plt

filtered_df = filtered_df.toPandas()

ax = sns.barplot(x="DeathsDirect", y="EventType",data=filtered_df)
ax.set_title('deaths per event type')
ax.set_xlabel('Deaths#')
ax.set_ylabel('Event Type')
plt.show()
Here is an example for Spark SQL on top of the temporary view.
%%sql

SELECT EventType, AVG(DamageProperty) AS avg_property_damage
FROM storm_dataset
GROUP BY EventType
ORDER BY avg_property_damage DESC
We calculated the average damage inflicted by each event type (avalanche, ice storm etc.). The below output is in the form of a column chart (but there are other options as well):

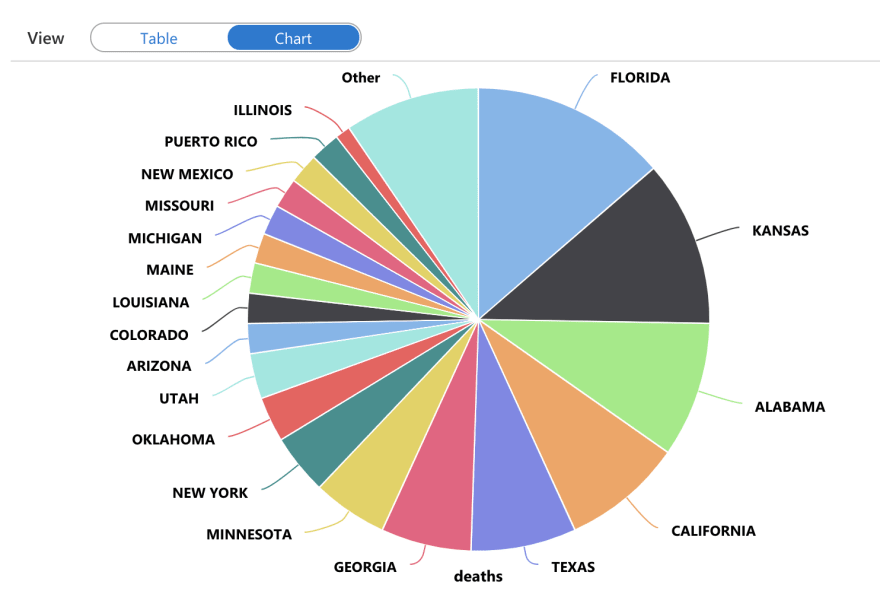
Here is a slight variation of the above, where we find out the maximum no. of deaths per State.
%%sql

SELECT
    State
    , MAX(DeathsDirect) AS deaths
FROM storm_dataset
GROUP BY State
ORDER BY deaths DESC
And a Pie chart output this time:
Now you know how to extract insights from existing data sets in Azure Data Explorer by processing using the Apache Spark pools in Azure Synapse.
This section will cover how to process data using Spark (Synapse Spark Pools to be precise) and write it to Azure Data Explorer for further analysis.
Start by creating another table StormEvents_2
.create table StormEvents_2 (StartTime: datetime, EndTime: datetime, EpisodeId: int, EventId: int, State: string, EventType: string, InjuriesDirect: int, InjuriesIndirect: int, DeathsDirect: int, DeathsIndirect: int, DamageProperty: int, DamageCrops: int, Source: string, BeginLocation: string, EndLocation: string, BeginLat: real, BeginLon: real, EndLat: real, EndLon: real, EpisodeNarrative: string, EventNarrative: string, StormSummary: dynamic)We will use existing CSV data. This is the same data that we had earlier ingested into Azure Data Explorer. But, this time, we will download it to our local machine and upload it to the ADLS Gen2 account associated with the Azure Synapse workspace.
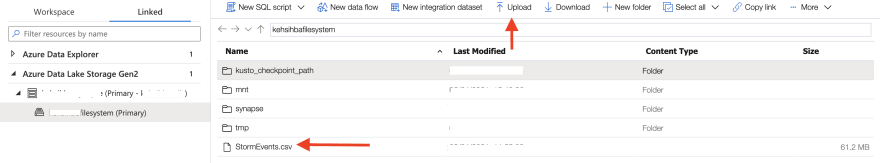
Start by downloading this file:
curl -o StormEvents.csv "https://kustosamplefiles.blob.core.windows.net/samplefiles/StormEvents.csv?sv=2019-12-12&ss=b&srt=o&sp=r&se=2022-09-05T02:23:52Z&st=2020-09-04T18:23:52Z&spr=https&sig=VrOfQMT1gUrHltJ8uhjYcCequEcfhjyyMX%2FSc3xsCy4%3D"Upload it to the ADLS file system using the workspace:
For the subsequent steps, you can either paste the code directly into a Synapse Studio notebook in Azure Synapse Analytics or import this notebook into the workspace.
Load the dataset from ADLS Gen2 to a DataFrame:
events = (spark.read
                .csv("/StormEvents.csv", header=True, inferSchema='true')
              )
Apply some basic filtering using Apache Spark — omit rows with null data, drop columns we don’t need for processing and filter rows where there has not been any property damage.
events_filtered = events.dropna() \
                        .drop('StormSummary', 'EndLat','EndLon','BeginLat','BeginLon') \
                        .filter((events.DamageProperty > 0))

print(events_filtered.count())
display(events_filtered.take(10))
Finally, write the DataFrame to Azure Data Explorer:
events_filtered.write \
    .format("com.microsoft.kusto.spark.synapse.datasource") \
    .option("spark.synapse.linkedService", "adx") \
    .option("kustoDatabase", "adxdb") \
    .option("kustoTable", "StormEvents_2") \
    .option("tableCreateOptions","FailIfNotExist") \
    .mode("Append") \
    .save()
Notice that we’ve used FailIfNotExist which implies that the operation will fail if the table is not found in the requested cluster and database.
The other option is CreateIfNotExist — if the table is not found in the requested cluster and database, it will be created, with a schema matching the DataFrame that is being written.
For more refer to https://github.com/Azure/azure-kusto-spark/blob/master/docs/KustoSink.md#supported-options
Give it a minute for the data to be written. Then you can execute Azure Data Explorer queries to your heart’s content! Try out the below:
.show ingestion failures

StormEvents_2| take 10

StormEvents_2
| summarize event_count=count() by bin(StartTime, 1d)
| render timechart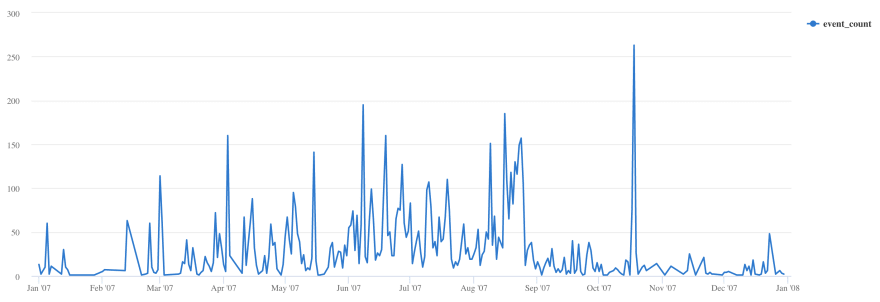
What you just executed was just a glimpse of a typical batch based data processing setup. But that’s not always going to be the case!
In this blog post, you learned:
How to setup and configure Azure Synapse and Azure Data Explorer (including secure access).
How to make the most of existing data in Azure Data Explorer and process it using Apache Spark pools in Azure Synapse.
How to process data from external sources and write the results back Azure Data Explorer for further analysis.
These were simple examples to help you get started. But, the full power of Apache Spark SQL, Python and Scala/Java libraries are available to you. I’d be remiss if I don’t mention Synapse SQL Pools (available in Serverless and Dedicated modes) that allows data access through T-SQL and open possibilities to a wide range of business intelligence, ad-hoc querying tools, and popular drivers.
🙏🏻 Thanks to Manoj Raheja and Adi Polak for their review and feedback! 🙏🏻
29