45
Real-Time Interactive Plotting (using Sockets, Python & Plotly)

In this article, I will explain the server-side implementation of a real-time plotting system. For the client-side, pleaser refer to this article
The real-time communication between the server and client is achieved by using WebSockets. You can learn more about web sockets here
I'll be using the following libraries/frameworks and languages:
I have also used Pandas & YFinance to fetch stock details but you can plug in your own data source.
Create a python virtual environment and activate it
python3 -m venv venv
source venv/bin/activate
Install requirements. The entire list of dependencies can be found here - requirements.txt
pip3 install -r requirements.txtHere I've handled the connection, disconnection, and sending the data to the client.
When a client connects to the server, a unique ID (session ID or Sid) is alloted to the client for further references during communications.
I stored this unique ID as
sid inside a list which holds all these sids of the connected clients. Once a client disconnects (which is generally by closing the browser tab), I remove the sid of that particular client from the list. The client emits an event called
ping_graph. The event handler ping_graph(line 22-34) is responsible for pinging the client continuously with the data it requested for (in this case symbol of the company for which it wants the plot for)A while loop runs as long as the client is connected with the server and keeps sending data (in this case the jsonified) version of the graph. Once the client disconnects, the loop stops running.
Now coming to the part where we actually plot the data. I used a library called Plotly which allows to create interactive plots easily in python.
I fetch stock data of a company from
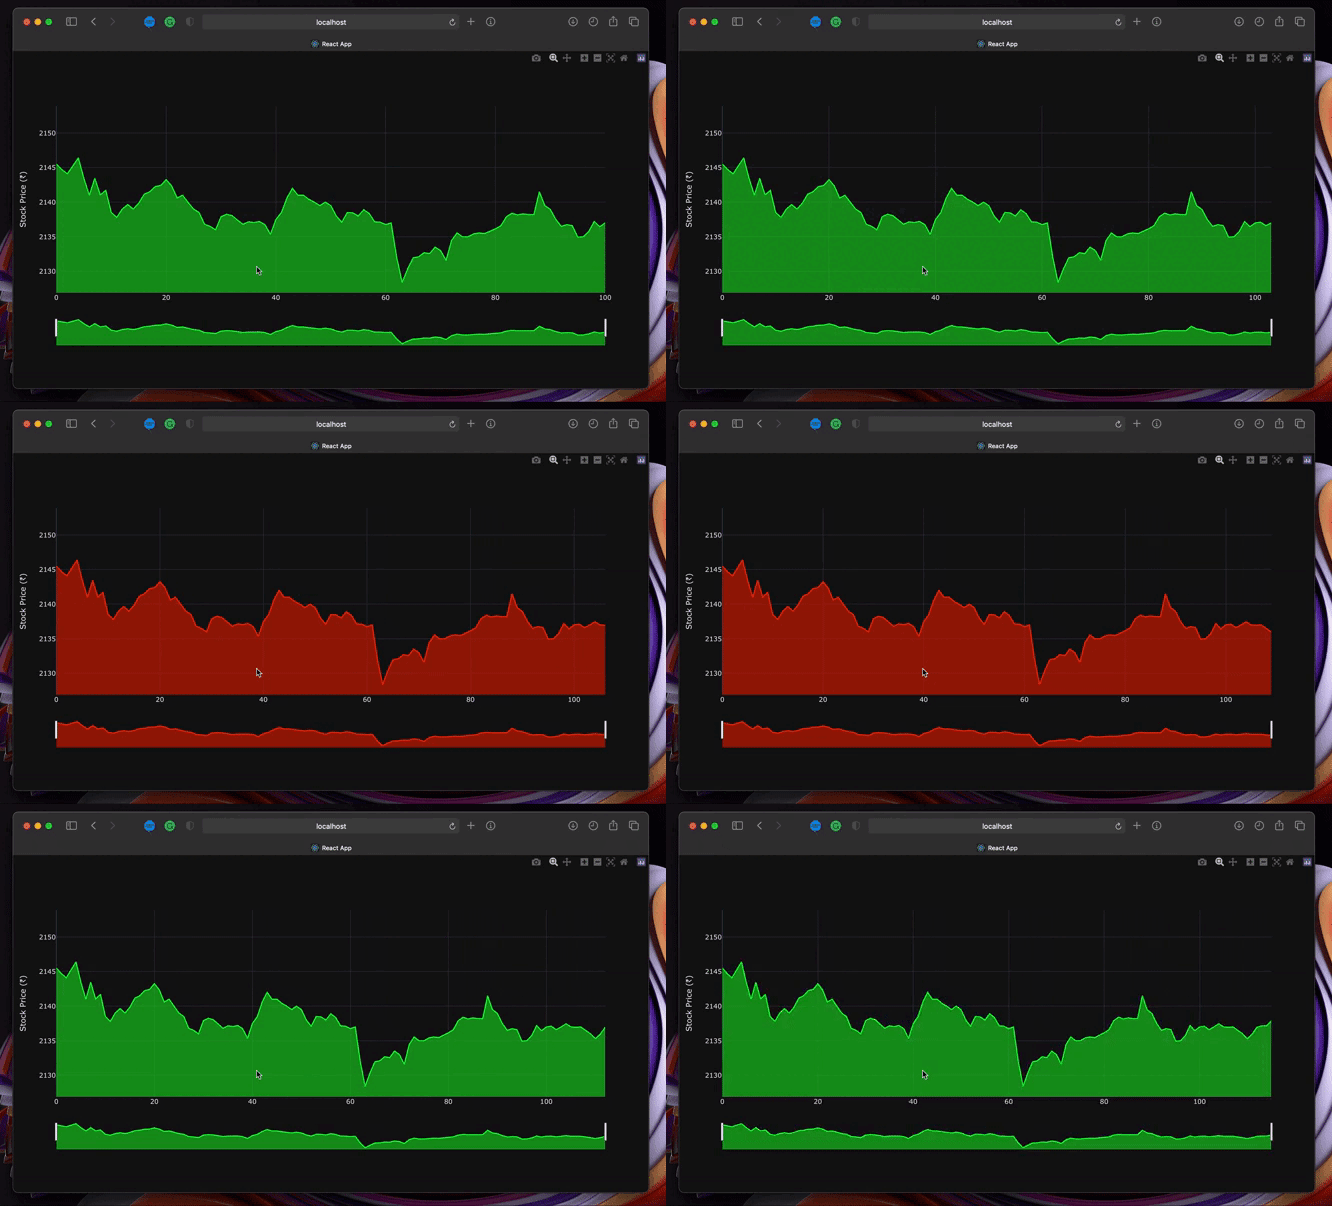
yfinance with 1 minute interval. Next I plot a mountain graph using the data. I've set the line color to change depending on whether the prices increase, decrease, or stay the same. I also added some buttons which will allow quick switching between ranges.Finally, I converted the entire figure to a JSON object which will be sent to the client side for rendering.
The steps to render the plot in using React can be found here
I use
gunicorn and eventlet to run the Socket.IO sereverexport PYTHONPATH=src
gunicorn -k eventlet -w 1 --reload src.main:appNote: This is what the directory structure looks like.
/
src/
├─ main.py
├─ scripts/
│  ├─ plot.py
requirements.txt
Link to GitHub Repository: Real Time Plot
Photo by Tech Daily on Unsplash
45
