
46
Processing Time-Series Data with Redis and Apache Kafka
Generally speaking, Time Series data is (relatively) simple. Having said that, we need to factor in other characteristics as well:
Thus, Time Series databases such as
RedisTimeSeries are just a part of the overall solution. You also need to think about how to collect (ingest), process and send all your data to RedisTimeSeries. What you really need is a scalable Data Pipeline that can act as a buffer to decouple producers, consumers.That's where Apache Kafka comes in! In addition to the core broker, it has a rich ecosystem of components, including Kafka Connect (which is a part of the solution architecture presented in this blog post), client libraries in multiple languages, Kafka Streams, Mirror Maker etc.

This blog post provides a practical example of how to use
RedisTimeSeries with Apache Kafka for analyzing time series data. GitHub repo - https://github.com/abhirockzz/redis-timeseries-kafka
Let's start off by exploring the use case first - please note that it has been kept simple for the purposes of the blog post, but the subsequent sections
Imagine there are many locations and each of them has multiple devices and you're tasked with the responsibility to monitor device metrics - for now we will consider
temperature and pressure. We will store these metrics in RedisTimeSeries (of course!) and use the following naming convention for the keys - <metric name>:<location>:<device>. For e.g. temperature for device 1 in location 5 will be represented as temp:5:1. each time series data point will also have the following labels (metadata) - metric, location, device. This is to allow for flexible querying as you will see later in the upcoming sections.Here are a couple of examples to give you an idea of how you would add data points using the
TS.ADD command:# temperature for device 2 in location 3 along with labels
TS.ADD temp:3:2 * 20 LABELS metric temp location 3 device 2
# pressure for device 2 in location 3
TS.ADD pressure:3:2 * 60 LABELS metric pressure location 3 device 2`Here is what the solution looks like at a high level:
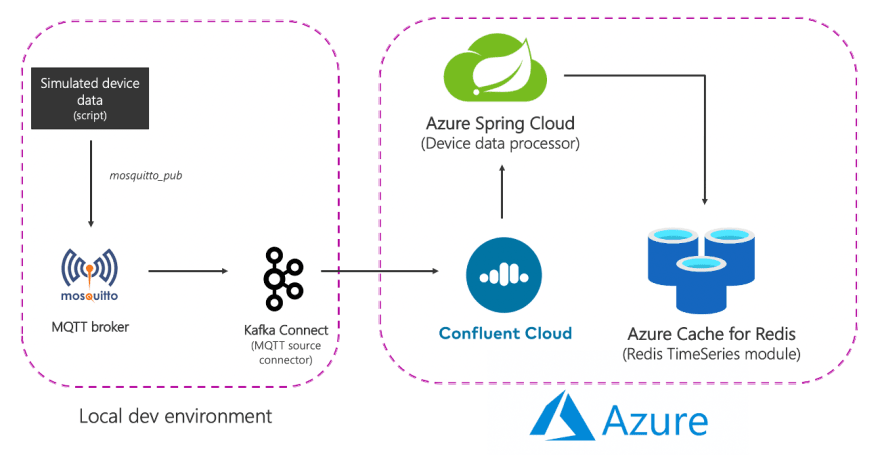
To summarise the end-to-end flow:
Simulated device data is sent to a local MQTT broker. this data is picked up by the MQTT Kafka connect source connector and sent to a confluent cloud Kafka cluster in Azure. it is processed by a spring application in Azure Spring Cloud which is finally sent to a Redis database in Azure.
It's time to dive in! Before that, make sure you have the following:
Follow the documentation to provision Azure Cache for Redis (Enterprise Tier) which comes with the
RedisTimeSeries module.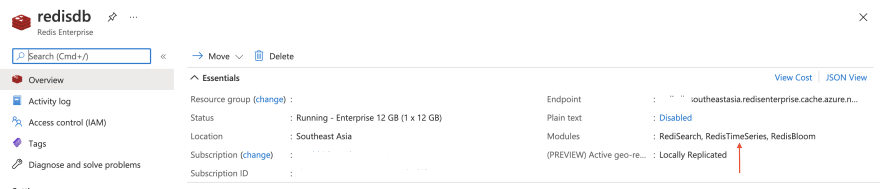
Provision Confluent Cloud cluster on Azure Marketplace and also create a Kafka topic (e.g.
mqtt.device-stats)
az spring-cloud create -n <name of Azure Spring Cloud service> -g <resource group name> -l <enter location e.g southeastasia>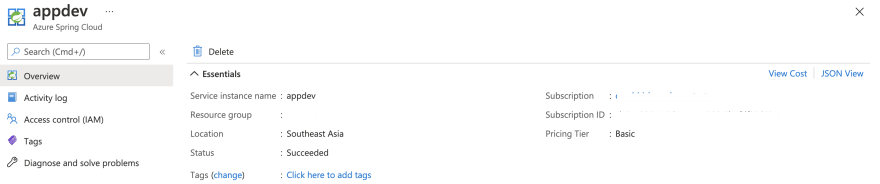
Before moving on, make sure to clone the GitHub repo:
git clone https://github.com/abhirockzz/redis-timeseries-kafka
cd redis-timeseries-kafkaThe components include:
I installed and started the
mosquitto broker locally on Mac.brew install mosquitto
brew services start mosquittoYou can follow steps corresponding your OS or feel free to use the this Docker image.
I installed and started Grafana locally on Mac.
brew install grafana
brew services start grafana
You can do the same for your OS or feel free to use this Docker image.
docker run -d -p 3000:3000 --name=grafana -e "GF_INSTALL_PLUGINS=redis-datasource" grafana/grafanaYou should be able to find the connect-distributed.properties file in the repo that you just cloned. Replace the values for properties such as bootstrap.servers, sasl.jaas.config etc.
First, download and unzip Apache Kafka locally.
Start a local Kafka Connect cluster
export KAFKA_INSTALL_DIR=<kafka installation directory e.g. /home/foo/kafka_2.12-2.5.0>
$KAFKA_INSTALL_DIR/bin/connect-distributed.sh connect-distributed.propertiesplugin.path configuration propertiesIf you're using Confluent Platform locally, simply use the CLI: confluent-hub install confluentinc/kafka-connect-mqtt:latest
Create MQTT source connector instance
Make sure to check the
mqtt-source-config.json file: make sure you enter the right topic name for kafka.topic and leave the mqtt.topics unchanged.curl -X POST -H 'Content-Type: application/json' http://localhost:8083/connectors -d @mqtt-source-config.json
# wait for a minute before checking the connector status
curl http://localhost:8083/connectors/mqtt-source/statusBuild the application JAR file:
cd consumer
export JAVA_HOME=/Library/Java/JavaVirtualMachines/zulu-11.jdk/Contents/Home

mvn clean package
Create an Azure Spring Cloud application and deploy the JAR file:
az spring-cloud app create -n device-data-processor -s <name of Azure Spring Cloud instance> -g <name of resource group> --runtime-version Java_11

az spring-cloud app deploy -n device-data-processor -s <name of Azure Spring Cloud instance> -g <name of resource group> --jar-path target/device-data-processor-0.0.1-SNAPSHOT.jarUse script to send data to local MQTT broker. You can use the script in the GitHub repo you just cloned:
./gen-timeseries-data.shAll it does is use the mosquitto_pub CLI command to send data
Data is sent to the
device-stats MQTT topic (this is not the Kafka topic). You can double check by using the CLI subscriber:mosquitto_sub -h localhost -t device-statsTo validate the end-to-end pipeline
Check the Kafka topic in the Confluent Cloud portal. You should also check the logs for the device data processor app in Azure Spring Cloud:
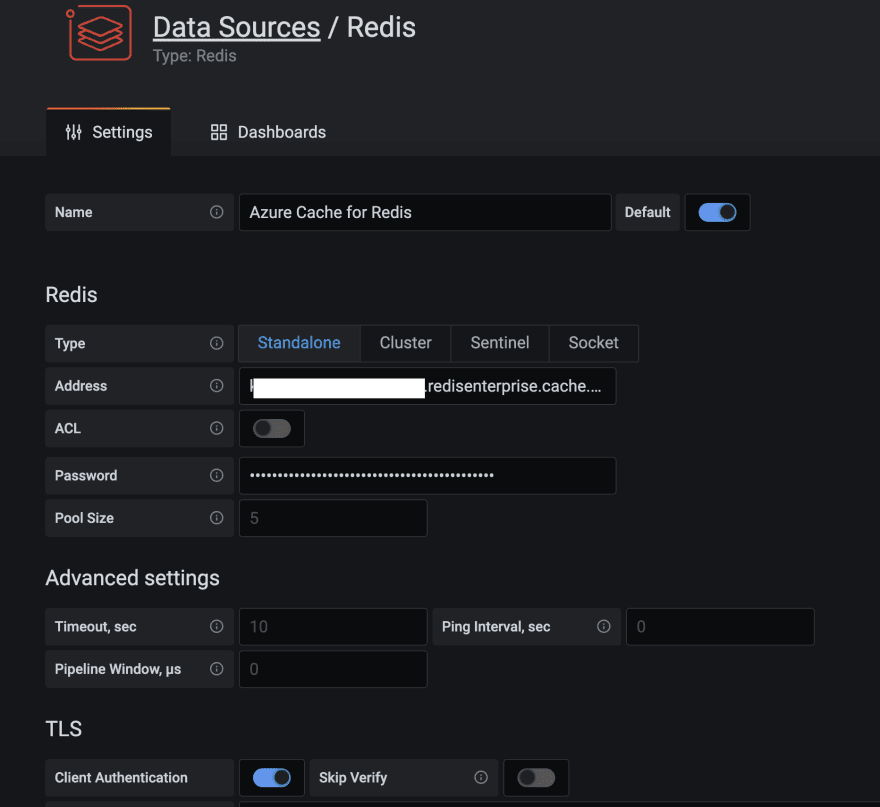
az spring-cloud app logs -f -n device-data-processor -s <name of Azure Spring Cloud instance> -g <name of resource group>Browse to the Grafana UI at
localhost:3000.The Redis Data Source plugin for Grafana works with any Redis database, including Azure Cache for Redis. Follow the instructions in this blog post to configure a data source.
Import the dashboards in the
grafana_dashboards folder in the GitHub repo you had cloned.Refer to the Grafana documentation if you need assistance on how to import dashboards.
For instance here is a dashboard that shows the average pressure (over 30 seconds) for device 5 in location 1 (uses
TS.MRANGE)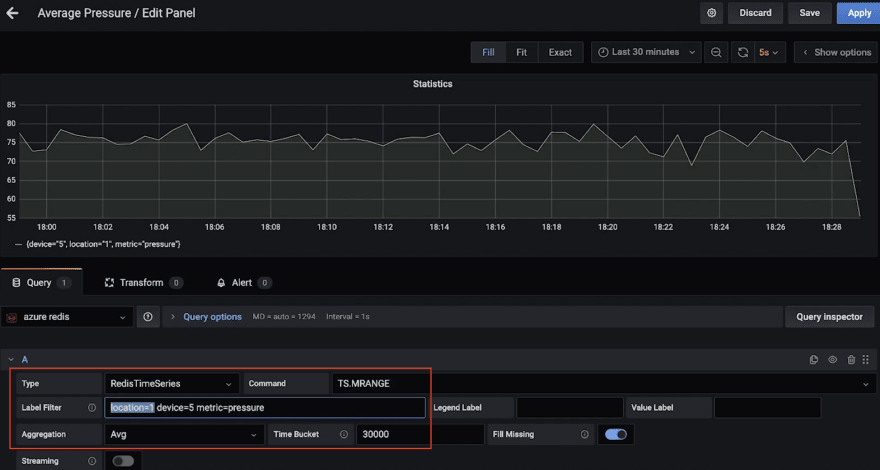
Here is another dashboard, that shows the maximum temperature (over 15 seconds) for multiple devices in location 3 (again, thanks to
TS.MRANGE).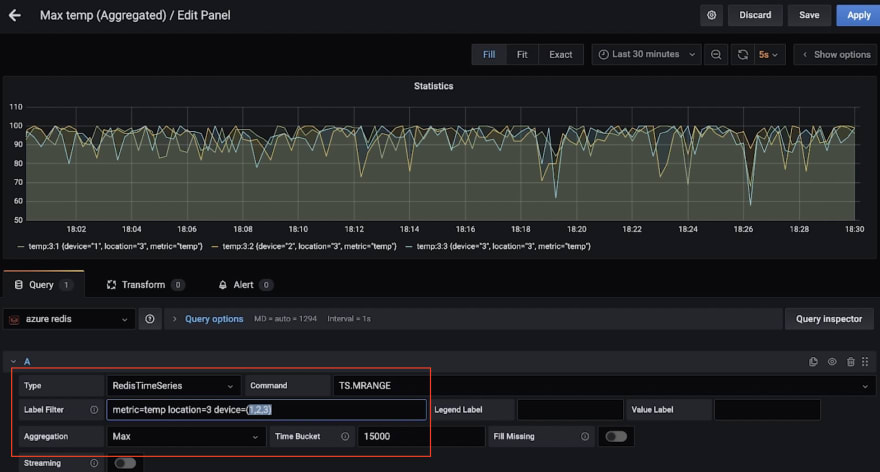
Crank up the
redis-cli and connect to the Azure Cache for Redis instance:redis-cli -h <azure redis hostname e.g. redisdb.southeastasia.redisenterprise.cache.azure.net> -p 10000 -a <azure redis access key> --tlsStart with simple queries:
# pressure in device 5 for location 1
TS.GET pressure:1:5

# temperature in device 5 for location 4
TS.GET temp:4:5
Filter by location and get temperature and pressure for all devices:
TS.MGET WITHLABELS FILTER location=3Extract temp and pressure for all devices in one or more locations within a specific time range:
TS.MRANGE - + WITHLABELS FILTER location=3
TS.MRANGE - + WITHLABELS FILTER location=(3,5)
- + refers to everything from beginning up until the latest timestamp, but you could be more specific
MRANGE is what we need! We can get back multiple time series and use filter.We can also filter by a specific device in a location and further drill down by either temperature or pressure:
TS.MRANGE - + WITHLABELS FILTER location=3 device=2
TS.MRANGE - + WITHLABELS FILTER location=3 device=2 metric=temp
All these can be combined with aggregations.
TS.MRANGE - + WITHLABELS FILTER location=3 metric=temp

# all the temp data points are not useful. how about an average (or max) instead of every temp data points?
TS.MRANGE - + WITHLABELS AGGREGATION avg 10000 FILTER location=3 metric=temp
TS.MRANGE - + WITHLABELS AGGREGATION max 10000 FILTER location=3 metric=temp
It's also possible to create a rule to do this aggregation and store in a different time series
Once you're done, don't forget to delete resources to avoid unwanted costs.
Delete resources:
On your local machine:
brew services stop mosquitto)brew services stop grafana)We explored a data pipeline to ingest, process and query time series data using Redis and Kafka. When you think about next steps and move towards a production grade solution, you should consider a few more things.

Optimising
RedisTimeSeriesTS.CREATERULE temp:1:2 temp:avg:30 AGGREGATION avg 30000)BLOCK) is indeed what you need. If not, consider other options.This is not an exhaustive list. For other configuration options, please refer to the RedisTimeSeries documentation
What about long term data retention?

Data is precious, including time series! You may want to process it further e.g. run Machine learning to extract insights, predictive maintenance etc. For this to be possible, you will need to retain this data for longer time frame and for this to be cost-effective and efficient, you would want to use a scalable Object storage service such Azure Data Lake Storage Gen2 (ADLS Gen2).
There is a connector for that! You could enhance you existing data pipeline by using the fully-managed Azure Data Lake Storage Gen2 Sink Connector for Confluent Cloud to process and store the data in ADLS and then run machine learning using Azure Synapse Analytics or Azure Databricks.
Scalability
Your time series data volumes can only move one way – up! It's critical for your solution to be scalable from variety of angles:
Integration: It's not just Grafana! RedisTimeSeries also integrates with Prometheus and Telegraf. However, there is no Kafka connector at the time this blog post was written - this would a great add-on!
Sure, you can use Redis for (almost) everything, including time series workloads! Be sure to think about the end-to-end architecture for data pipeline and integration from time series data sources, all the way to Redis and beyond.

46