
33
Profiling and Analyzing Performance of Python Programs
Profiling is integral to any code and performance optimization. Any experience and skill in performance optimization that you might already have will not be very useful if you don't know where to apply it. Therefore, finding bottlenecks in your applications can help you solve performance issues quickly with very little overall effort.
In this article we will look at the tools and techniques that can help us narrow down our focus and find bottlenecks both for CPU and memory consumption, as well as how to implement easy (almost zero-effort) solutions to performance issues in cases where even well targeted code changes won't help anymore.
It's good to be lazy when it comes to performance optimization. Instead of trying to figure out which part of a codebase is making an application slow, we can just use profiling tools to find the areas that need attention or further digging.
The most common tool for this task used by Python developers is
cProfile. It's a builtin module that can measure execution time of each function in our code.Let's consider the following function that (slowly) computes
e to the power of X:# some-code.py
from decimal import *
def exp(x):
getcontext().prec += 2
i, lasts, s, fact, num = 0, 0, 1, 1, 1
while s != lasts:
lasts = s
i += 1
fact *= i
num *= x
s += num / fact
getcontext().prec -= 2
return +s
exp(Decimal(3000))Now, let's run
cProfile against the above slow code:python -m cProfile -s cumulative some-code.py
1052 function calls (1023 primitive calls) in 2.765 seconds
Ordered by: cumulative timek
ncalls tottime percall cumtime percall filename:lineno(function)
5/1 0.000 0.000 2.765 2.765 {built-in method builtins.exec}
1 0.000 0.000 2.765 2.765 some-code.py:1(<module>)
1 2.764 2.764 2.764 2.764 some-code.py:3(exp)
4/1 0.000 0.000 0.001 0.001 <frozen importlib._bootstrap>:986(_find_and_load)
4/1 0.000 0.000 0.001 0.001 <frozen importlib._bootstrap>:956(_find_and_load_unlocked)
4/1 0.000 0.000 0.001 0.001 <frozen importlib._bootstrap>:650(_load_unlocked)
3/1 0.000 0.000 0.001 0.001 <frozen importlib._bootstrap_external>:842(exec_module)
5/1 0.000 0.000 0.001 0.001 <frozen importlib._bootstrap>:211(_call_with_frames_removed)
1 0.000 0.000 0.001 0.001 decimal.py:2(<module>)
...Here we used
-s cumulative to sort the output by cumulative time spend in each function, making it easier to find the problematic areas of code in the output. We can see that pretty much all time (~2.764 sec) was spent in the exp function during the single invocation.This kind of profiling can be useful, but unfortunately might not be always sufficient.
cProfile only gives information about function calls, not about individual lines of code - if you call some particular function such as append in different places, then it will be all aggregated into single line in cProfile output. Same goes for scripts like the one we used above - it contains single function that gets called just once, so there's not much for cProfile to report.Sometimes we don't have the luxury of being able to analyze the troublesome code locally, or we might need to analyze a performance issue on the fly when it arises in production environment. In these situations we can make use of
py-spy which is a profiler that can introspect already running program, for example an application in production environment or on any remote system:pip install py-spy
python some-code.py &
[1] 1129587
ps -A -o pid,cmd | grep python
...
1129587 python some-code.py
1130365 grep python
sudo env "PATH=$PATH" py-spy top --pid 1129587In the above snippet we first install
py-spy and then run our long-running Python program in background. This will show PID number automatically, but if we didn't know it, then we could use the ps command to look it up. Finally, we run py-spy in top mode passing in the PID. This will produce terminal view that mimics the auto-updating output of Linux top utility, similar to the screenshot below. 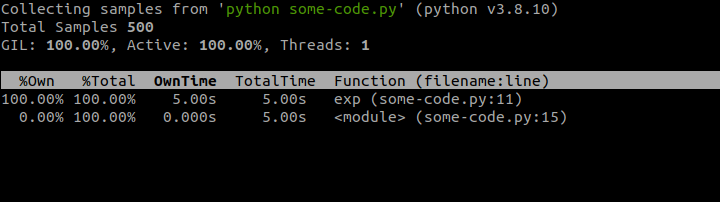
This doesn't really give us that much info, because this script has just one long-running function, but in real-world scenarios, you would most likely see many functions sharing the CPU time, which might help shed some light on ongoing performance issues of the program.
The above profilers should help you find function(s) that are causing performance issues, but if that doesn't narrow down the focus area enough for you to know what to fix, then we can turn to profilers that operate on more granular level.
First of those is
line_profiler which - as the name suggests - can be used to drill down on time spend on each individual line of code:# https://github.com/pyutils/line_profiler
pip install line_profiler
kernprof -l -v some-code.py # This might take a while...
Wrote profile results to some-code.py.lprof
Timer unit: 1e-06 s
Total time: 13.0418 s
File: some-code.py
Function: exp at line 3
Line # Hits Time Per Hit % Time Line Contents
==============================================================
3 @profile
4 def exp(x):
5 1 4.0 4.0 0.0 getcontext().prec += 2
6 1 0.0 0.0 0.0 i, lasts, s, fact, num = 0, 0, 1, 1, 1
7 5818 4017.0 0.7 0.0 while s != lasts:
8 5817 1569.0 0.3 0.0 lasts = s
9 5817 1837.0 0.3 0.0 i += 1
10 5817 6902.0 1.2 0.1 fact *= i
11 5817 2604.0 0.4 0.0 num *= x
12 5817 13024902.0 2239.1 99.9 s += num / fact
13 1 5.0 5.0 0.0 getcontext().prec -= 2
14 1 2.0 2.0 0.0 return +sline_profiler library is distributed together with kernprof CLI (named after Robert Kern) used to effectively analyze results of test runs. By running this utility against our code we produce a .lprof file with code analysis as well as the above output (when -v is used). This output clearly shows where in the function we spend the most amount of time, which greatly helps with finding and fixing the performance issue. In the output, you will also notice the @profile decorator was added to the exp function - that's necessary so that line_profiler knows which function in the file we want to analyze.Even when running analysis on per-line basis, it still might not be clear what is the culprit of performance issues. Example of this could be
while or if conditionals composed of multiple expression. In cases like these, it would make sense to rewrite the specific line into multiple ones to get more comprehensive analysis results.If you're truly lazy developer (as me) and reading CLI text output is too much to ask, then another option is to use
pyheat. This is a profiler based on pprofile - another line-by-line profiler, inspired by line_profiler - which generates a heat map of code lines/areas that are taking the most amount of time:pip install py-heat
pyheat some-code.py --out image_file.png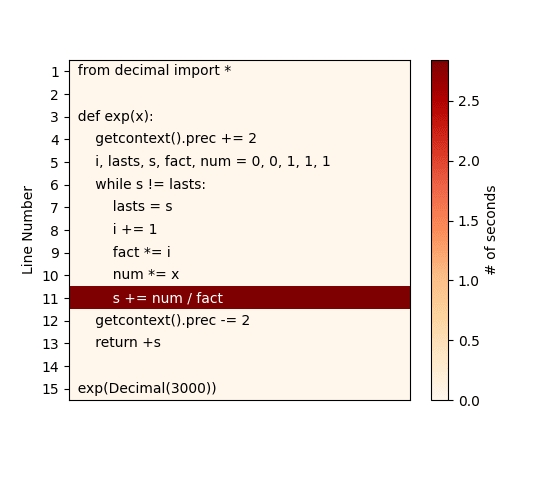
Considering the simplicity of our sample code we used, the CLI output from
kernprof earlier was already pretty clear, but the above heat map makes the bottleneck in the function even more obvious. So far, we've spoken about CPU profiling, but CPU usage might not always be what we care about. RAM is cheap, so we don't usually think about its usage, well at least until we run out of it.
Even if you're not running out of RAM, it still makes sense to profile your application for memory usage to find out whether you can optimize code to save memory or whether you can add more memory to improve performance of your code. To analyze memory usage we can use tool called
memory_profiler which mimics the behaviour of earlier shown line_profiler:# https://github.com/pythonprofilers/memory_profiler
pip install memory_profiler psutil
# psutil is needed for better memory_profiler performance
python -m memory_profiler some-code.py
Filename: some-code.py
Line # Mem usage Increment Occurrences Line Contents
============================================================
15 39.113 MiB 39.113 MiB 1 @profile
16 def memory_intensive():
17 46.539 MiB 7.426 MiB 1 small_list = [None] * 1000000
18 122.852 MiB 76.312 MiB 1 big_list = [None] * 10000000
19 46.766 MiB -76.086 MiB 1 del big_list
20 46.766 MiB 0.000 MiB 1 return small_listFor this test we chose a little different piece of code. The
memory_intensive function creates and deletes large Python lists to clearly demonstrate how memory_profiler can be helpful in analyzing memory usage. Same as with kernprof profiling, here we also have to tack on @profile to function under text for memory_profiler to recognize which part of code we want to profile.This shows that upwards of 100MiB were allocated just for a simple list of
None values. Bear in mind though, that this output doesn't show true usage of memory, but rather how much memory was allocated by function call on each line. In this case that means that the list variables aren't actually storing as much memory, just that Python list is likely to over-allocate memory to accommodate for the expected growth of the variable.As we can see from the above, Python lists can oftentimes consume hundreds of megabytes or even gigabytes of memory, one quick optimization can be switching to plain
array objects instead, which stores primitive datatypes, such as int or float more efficiently. Additionally, you can also limit memory usage by choosing lower precision type using typecode parameter, use help(array) to see table of valid options and their sizes.If even these more specific and granular tools aren't sufficient at finding bottlenecks in your code, then you can try disassembling it and see the actual bytecode used by Python interpreter. Even if the disassembly doesn't help you solve the problem at hand, it will still be useful at getting better idea and understanding of which operations are performed by Python in the background each time you invoke some particular function. Keeping these facts in mind might help you write more performant code in the future.
Code disassembly can be generated using the builtin
dis module, by passing a function/code/module to dis.dis(...). This generates and prints a list of bytecode instructions performed by the function.from math import e
def exp(x):
return e**x # math.exp(x)
import dis
dis.dis(exp)Throughout whole article we've been using very slow implementation of
e to power of X, so above we defined trivial function that does it fast, so that we can compare their disassemblies. Trying to disassemble both of them will lend a wildly different outputs that makes it even more obvious why one is significantly slower than the other.The fast one:
2           0 LOAD_GLOBAL              0 (e)
              2 LOAD_FAST                0 (x)
              4 BINARY_POWER
              6 RETURN_VALUE
The old, slow version:
4           0 LOAD_GLOBAL              0 (getcontext)
              2 CALL_FUNCTION            0
              4 DUP_TOP
              6 LOAD_ATTR                1 (prec)
              8 LOAD_CONST               1 (2)
             10 INPLACE_ADD
             12 ROT_TWO
             14 STORE_ATTR               1 (prec)

  5          16 LOAD_CONST               2 ((0, 0, 1, 1, 1))
             18 UNPACK_SEQUENCE          5
             20 STORE_FAST               1 (i)
             22 STORE_FAST               2 (lasts)
             24 STORE_FAST               3 (s)
             26 STORE_FAST               4 (fact)
             28 STORE_FAST               5 (num)

  6     >>   30 LOAD_FAST                3 (s)
             32 LOAD_FAST                2 (lasts)
             34 COMPARE_OP               3 (!=)
             36 POP_JUMP_IF_FALSE       80
...
             100 RETURN_VALUE
To better understand what is actually happening in the above output, I recommend reading this StackOverflow answer, which explains all columns in the output.
At some point, making additional tweaks to your code and algorithms will start providing diminishing returns. At that time, it's a good idea to turn your attention to external tools to provide some additional performance boost.
A sure way to get speed improvement in your code is to compile it to C. That can be done using various tools, for example PyPy or Cython. The former is a JIT (Just-In-Time) compiler which can be used as drop-in replacement for CPython. It can provide a significant performance boost with zero effort, giving you an easy, quick win. All you need to do is download the archive, untar it and run your code:
# Download from https://www.pypy.org/download.html
tar -xjf pypy3.8-v7.3.7-linux64.tar.bz2
cd pypy3.8-v7.3.7-linux64/bin
./pypy some-code.py
And just to prove to you that we will get immediate performance improvement with zero effort, let's just quickly check the run-time of the script with CPython and PyPy:
time python some-code.py

real    0m2,861s
user    0m2,841s
sys     0m0,016s

time pypy some-code.py

real    0m1,450s
user    0m1,422s
sys     0m0,009s
In addition to the above-mentioned benefits, PyPy also doesn't require any changes to code and supports all builtin modules and functions.
This all sounds amazing, but there are some trade-offs that come with using PyPy. It supports projects that require C bindings, such as
numpy, but that creates big overhead, making the libraries significantly slower, effectively negating any other performance gains. It will also not solve your performance issues in situations where you use external libraries or when interacting with databases. Similarly, you can't expect a lot of performance gains in I/O-bound programs.If PyPy isn't cutting it, then you can try using Cython - a compiler which uses C-like type annotation (not Python type hints) to create compiled Python extension modules. Cython also uses AOT (ahead-of-time) compilation, which can bring bigger performance gains by avoiding application cold start. Using it however, requires you to rewrite you code to work with Cython syntax, which in turn increases complexity of your code.
If you don't mind switching to a little different syntax of Python, then you also might want to take a look at prometeo - an embedded domain specific language based on Python, specifically aimed at scientific computing. Prometeo programs transpile to pure C code and its performance can be comparable with hand-written C code.
If none of the above solutions satisfy the performance requirements, then you might have to write your optimized code in C or Fortran a use Foreign Function Interfaces (FFI) to call the code from Python. Examples of libraries that can help you with that would be
ctypes or cffi for C code and f2py for Fortran.The first rule of optimization is to not do it. If you really have to though, then optimize where appropriate. Use the above profiling tools to find bottlenecks, so you don't waste time optimizing some inconsequential piece of code. It's also useful to create a reproducible benchmark for the piece of code you're trying to optimize, so that you can measure the actual improvement.
This article should help you find the culprit of performance issue. Fixing the issue is however, completely different topic, some easy way to make you Python code significantly faster can be found in my previous article Making Python Programs Blazingly Fast.
33