
48
Xdebug in PHPStorm with Docker
In my last post, I've talked about how to configure Xdebug in VSCode with Docker. Now, I would like to share how we can build upon our previous Dockerfile in a way that Xdebug can run directly from Docker and also connect it with PhpStorm.
By choosing this approach, we substantially reduce the amount of setup that each team member has to do on their machine to get the project up and running, which means that we can start writing code faster.
So, why is this so important? A recent research from JetBrains shows that 68% of the PHP developers debug their code using var_dump(), die(), dd() and dump(). From my perspective, there isn't anything wrong with that if you are doing it by choice and not lacking knowledge.
I'm included in the 68% of developers debugging their code with auxiliary functions instead of using a full-featured debug solution such as Xdebug. Not for lacking knowledge but because I'm a heavy Neovim user and I didn't adapt quite well using Neovim with Xdebug, to me, is just easier and faster to use my code snippets around the dd() function.
But from time to time, I caught myself in situations where it would be faster to jump into PhpStorm Studio Code and just use Xdebug, especially when I'm working with other people that aren't familiarized with Vim/Neovim.
Before jumping into PhpStorm, first we have to clear a few things about Xdebug to fully grasp the changes we’re going to make on the IDE. The information got first introduced on the topic about the command directive in a previous post. You will notice that at some point a xdebug.ini file gets copied from a local .docker folder into /etc/php8/conf.d/50_xdebug.ini at the container.
Even though the content of the file got shown, I intentionally didn't explain its content so that we could explore the debugging topic all at once, going all the way from configuring Xdebug to using it with an IDE.
Down below, we have the same Xdebug config file, from the previous post, living under .docker/xdebug.ini at the root of our Laravel project. The file directives will be explained further, but in case you want to know every configuration that you can add in this file, check the Xdebug documentation.
zend_extension=xdebug.so
xdebug.mode=develop,coverage,debug,profile
xdebug.idekey=docker
xdebug.start_with_request=yes
xdebug.log=/dev/stdout
xdebug.log_level=0
xdebug.client_port=9003
xdebug.client_host=<YOUR_COMPUTER_IP>A Zend extension hooks into “lower level” languages, a single extension can be both a PHP and a Zend extension, despite being very uncommon it's possible and Xdebug is a good example of it.
This setting controls which Xdebug features gets enabled, according to the documentation the following values gets accepted:
- develop
    Enables Development Helpers, including the overloaded var_dump().
- coverage
    Enables Code Coverage Analysis to generate code coverage reports, mainly with PHPUnit.
- debug
    Enables Step Debugging. This can be used to step through your code while it is running, and analyze values of variables.
- profile
Enables Profiling, with which you can analyze performance bottlenecks with tools like CacheGrind.Controls which IDE Key Xdebug should pass on to the debugging client or proxy. The IDE Key is only important for use with the DBGp Proxy Tool, although some IDEs are incorrectly picky as to what its value is. The default gets based on the DBGP_IDEKEY environment setting. If it is not present, the default falls back to an empty string.
The functionality starts when the PHP request starts, and before any PHP code getting executed. For example, xdebug.mode=trace and xdebug.start_with_request=yes starts a Function Trace for the whole request.
Configure Xdebug's log file, but in here, we are redirecting the log content to the default stdout of our container.
In case you don't want to see these logs you can comment out this line of your .docker/xdebug.ini file by changing the line to ;xdebug.log=/dev/stdout.
Configures which logging messages should be added to the log file. In here we are instructing Xdebug to log only errors in the configuration, in case you want to see more information you can use the level 7 for log info or the level 10 for log debug.
The port to which Xdebug tries to connect on the remote host. Port 9003 is the default for both Xdebug and the Command Line Debug Client. As many clients use this port number, it is best to leave this setting unchanged.
Configures the IP address or hostname where Xdebug will attempt to connect to when initiating a debugging connection. This address should be the address of the machine where your IDE or debugging client is listening for incoming debugging connections.
Down below, you can see how to correctly get your IP address in the main OS developers use. In case you are using a different OS, the commands may serve you as base to try to extrapolate a solution for your use case.
macOS:
ipconfig getifaddr en1Windows with WSL:
grep nameserver /etc/resolv.conf | cut -d ' ' -f2Linux (Debian based distros):
hostname -I | cut -d ' ' -f1Once you correctly found your IP address, you can place him into the xdebug.client_host as mentioned before, and that will leave you with a directive looking similar to this xdebug.client_host=192.168.0.158.
In summary, you've instructed Xdebug to start from a request and try to send the debug events to the host with the IP 192.168.0.158 on the port 9003. Since the IP represents your computer, these means that when configuring PhpStorm to connect into Xdebug, the configuration will be extremely similar to when connecting to the localhost.
As you may already know, PhpStorm is a proprietary, cross-platform IDE for PHP, built by the Czech Republic-based company JetBrains. PhpStorm provides an editor for PHP, HTML, and JavaScript with on-the-fly code analysis, error prevention and automated refactorings for PHP and JavaScript code.
With that being said, you may be wondering… what do we need to have PhpStorm with all the aspects of an IDE with full-featured debug?
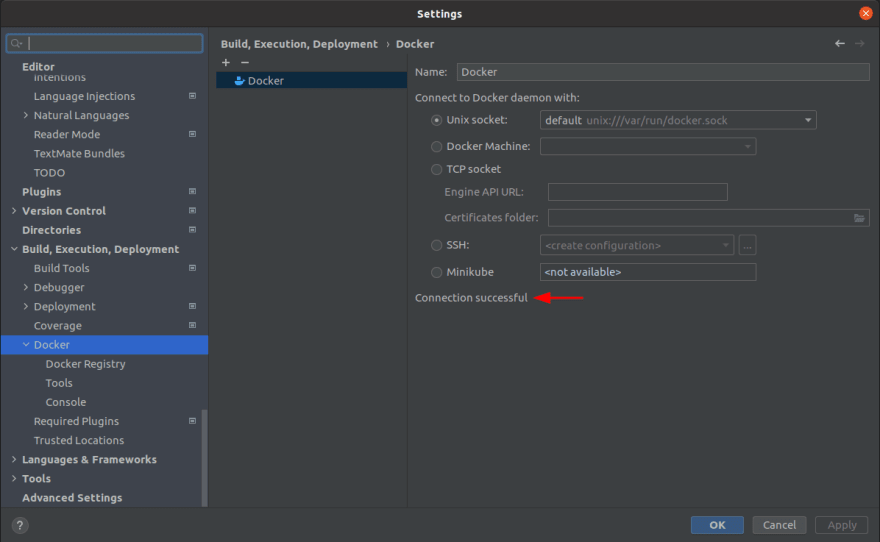
For starters, we need to check if the IDE can properly connect with Docker:
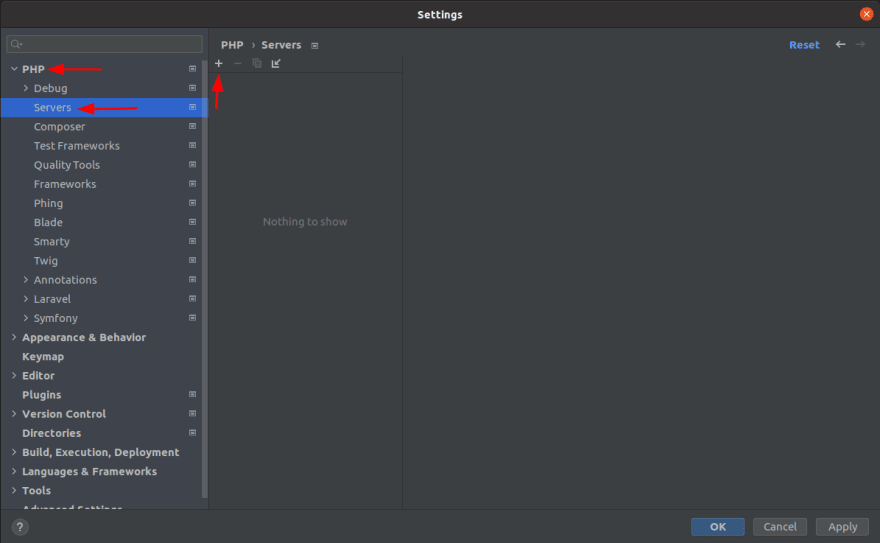
Thereafter, we need to configure a PHP server, it can be done by going to File > Settings > PHP > Servers, then click in the plus sign, as the following screenshot shows:
Once you clicked in the plus sign a form will open, there the Name, Host, Port, and Absolute path of the server have to be filled:
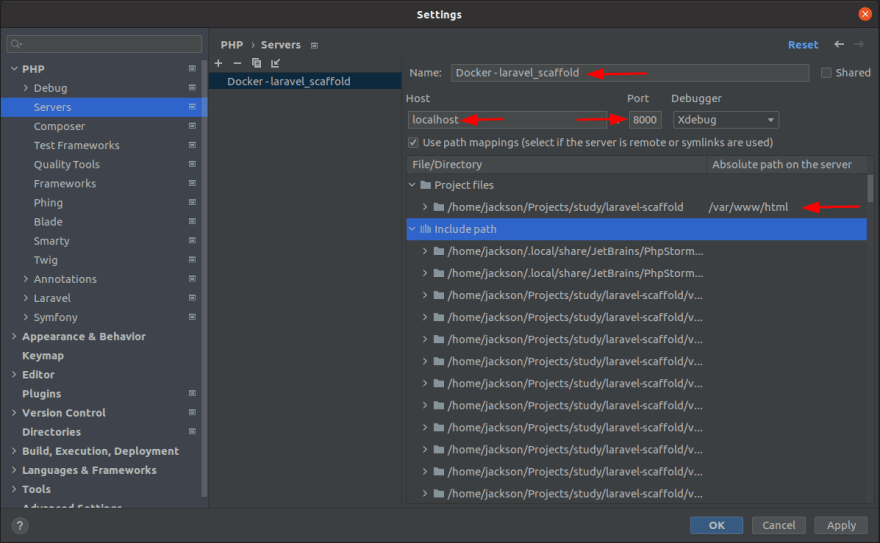
Notice that the Port matches the port from our previsouly built docker-compose.yml and the Absolute path on the server matches the workdir from our previously built Dockerfile.
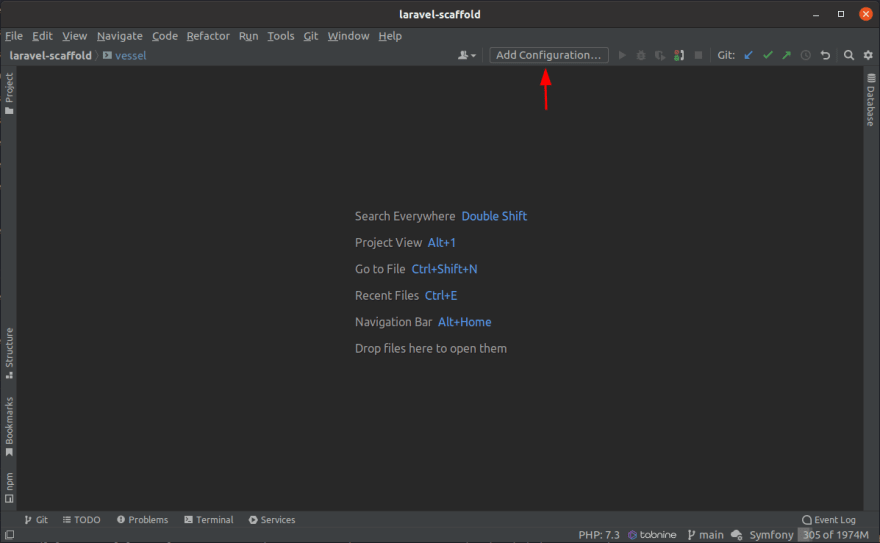
Now, that the server got created we can move to the debug configuration, let's start by clicking in the Add Configuration… button as the next screenshot shows:
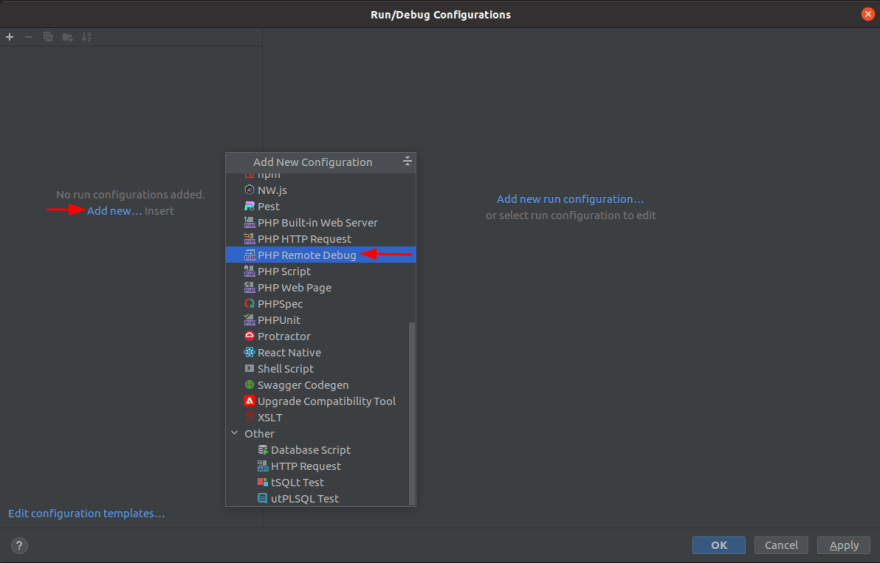
Subsequently, click into the Add new… > PHP Remote Debug as the screenshot down below shows:
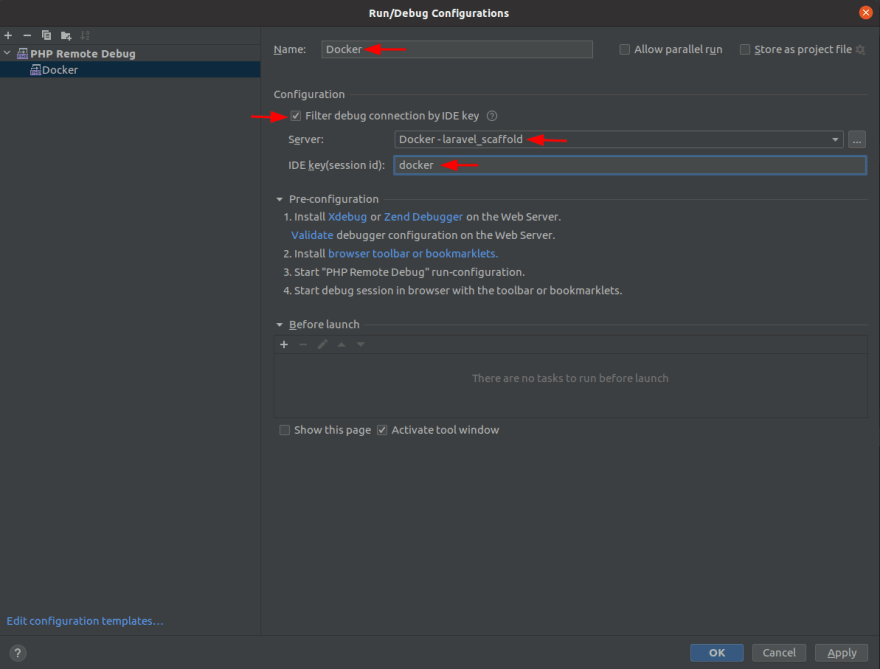
Next, a form will open and there, fill the Name with your Remote Debug configuration, next check the Filter debug connection by IDE key option and then select the Server previously create, and finally fill the IDE key(session id) with the same value that got used at the xdebug.idekey directive at our .docker/xdebug.ini. More details in the illustration down below:
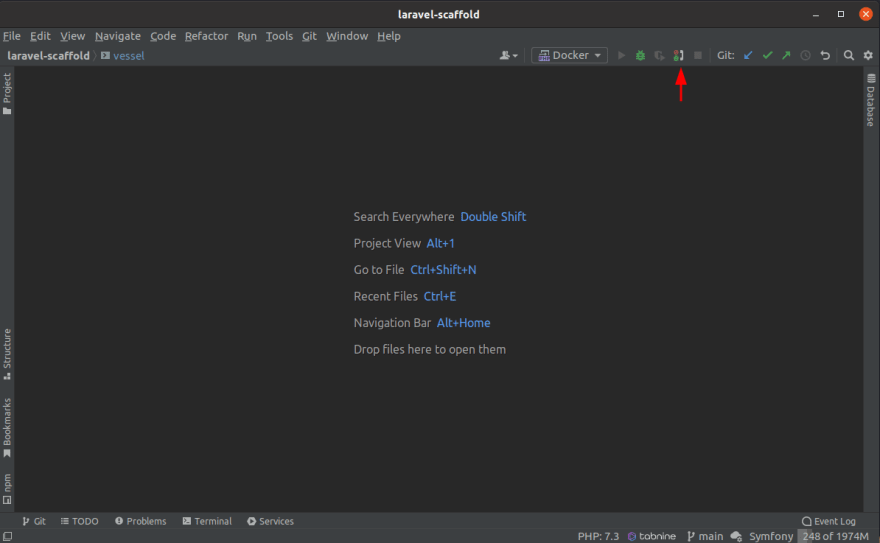
As a result of the previous steps the remote debug configuration got finished and PhpStorm can now start listening for PHP debug connection, click into the indicated button as shown:
And then, as a final step, click in the debug button. Once the debug is running, you can trigger a request thought postman or your tests, and PhpStorm will intercept the event and stop at the first breaking point found.

Now Xdebug is finally configured in your PhpStorm, and you can enjoy a more robust debugging tool with the potential to speed up your entire workflow.
Happy coding!
48