
24
How to build a marketing dashboard (twitter & youtube) with React
Integrations play a huge role in communicating across different services. In this guide, we'll build a marketing analytical dashboard with Twitter and Youtube integrations. This dashboard can be used to track stats across both platforms in a single view.
We're looking to build something like this 👇

We'll be using:
Step 1: Getting started with the project
To create the project, we'll use
create-react-app. Execute the command below in a terminal to create the basic boilerplate setup. We'll name our project marketing-dashboard.npx create-react-app marketing-dashboardStep 2: Add the dependencies
Let's add all the dependencies listed above for ui and GraphQL. Navigate to project folder, and start adding the dependencices.
yarn add @blueprintjs/core @apollo/client graphql@15.7.1 react-chartjs-2 chart.jsNow let's discuss the project setup. We'll have three top level component setups:
Step 3: Building top level components
Let's first modify
App.js to accommodate for our top level components. We'll add the Header and Footer components directly in the App and create space for Twitter and Youtube components. While we're at it, might as well add some styling :P// Import React and Blueprint dependencies
import React from "react";
import "@blueprintjs/core/lib/css/blueprint.css";
import { Navbar, Alignment, Divider } from "@blueprintjs/core";
import "./App.css";
const App = () => {
return (
<div className="App">
{/* Header */}
<Navbar className="bp3-dark" style={{ position: "fixed", top: "0" }}>
<Navbar.Group align={Alignment.LEFT}>
<Navbar.Heading style={{ marginLeft: "30px" }}>
Marketing Dashboard
</Navbar.Heading>
</Navbar.Group>
</Navbar>
{/* Middle Container to hold our Metrics */}
<div
style={{ marginLeft: "30px", marginTop: "80px", marginRight: "30px" }}
>
<div style={{ marginTop: "50px" }}>
{/* Youtube component will go here */}
</div>
<Divider style={{ marginTop: "50px" }}></Divider>
<div style={{ marginTop: "50px" }}>
{/* Twitter component will go here */}
</div>
<Divider style={{ marginTop: "50px" }}></Divider>
</div>
{/* Footer */}
<div>
<h5
style={{
fontSize: "medium",
textAlign: " left",
margin: "30px 30px 20px 30px",
}}
>
Canonic ©2021 Created by Canonic Inc
</h5>
</div>
</div>
);
};
export default App;Remove all of the preloaded CSS in
App.css file.Step 4: Mocking data to display
We'll create dummy data that mimics the API response and feeds directly into our
Twitter and Youtube components.Let's create
dummyData.js at src directory and add the following dummy data containing metrics for both the platforms.export const dummyData = {
metric: {
youtubeMetrics: {
rows: [[745, 2, 16, 1, 597, 48]],
columnHeaders: [
{
columnType: "METRIC",
dataType: "INTEGER",
name: "views",
},
{
columnType: "METRIC",
dataType: "INTEGER",
name: "comments",
},
{
columnType: "METRIC",
dataType: "INTEGER",
name: "likes",
},
{
columnType: "METRIC",
dataType: "INTEGER",
name: "dislikes",
},
{
columnType: "METRIC",
dataType: "INTEGER",
name: "estimatedMinutesWatched",
},
{
columnType: "METRIC",
dataType: "INTEGER",
name: "averageViewDuration",
},
],
},
youtubeMinutesDay: {
rows: [
["2020-10-17", 0],
["2020-10-18", 1],
["2020-10-19", 4],
["2020-10-20", 0],
["2020-10-21", 4],
["2020-10-22", 4],
["2020-10-23", 1],
["2020-10-24", 4],
["2020-10-25", 0],
["2020-10-26", 1],
["2020-10-27", 0],
["2020-10-28", 0],
["2020-10-29", 0],
["2020-10-30", 1],
["2020-10-31", 0],
["2020-11-01", 1],
["2020-11-02", 1],
["2020-11-03", 2],
["2020-11-04", 5],
["2020-11-05", 0],
["2020-11-06", 1],
["2020-11-07", 0],
["2020-11-08", 5],
["2020-11-09", 3],
],
columnHeaders: [
{
columnType: "DIMENSION",
dataType: "STRING",
name: "day",
},
{
columnType: "METRIC",
dataType: "INTEGER",
name: "estimatedMinutesWatched",
},
],
},
youtubeMinutesCountry: {
rows: [
["IN", 30],
["US", 12],
],
columnHeaders: [
{
columnType: "DIMENSION",
dataType: "STRING",
name: "country",
},
{
columnType: "METRIC",
dataType: "INTEGER",
name: "estimatedMinutesWatched",
},
],
},
twitter: {
data: {
name: "Canonic",
username: "CanonicHQ",
profile_image_url:
"https://pbs.twimg.com/profile_images/1316281577148571653/-12Ans7U_normal.jpg",
location: "United States",
description:
"The lowcode backend to your frontend. Ranked #3 Product of the day on @producthunt #lowcode #nocode #reactjs #graphql #technology #automation #backend",
public_metrics: {
followers_count: 394,
following_count: 641,
tweet_count: 161,
listed_count: 25,
},
},
},
},
};When we're feeding this data into our components, we need to normalise it so that we can display the data efficiently. To achieve this, we'll create utility functions that will transform this data into a more readable format.
Create a new directory -
utils at src/ and a new file inside src/utils/normaliseData.js. Inside normaliseData.js we'll add functions to convert normalise youtube data, twitter data, as well as data for our charts.export const normaliseTwitterData = (twitter) => {
if (Object.keys(twitter).length === 0) {
return { accountInformation: {}, metrics: [] };
}
const twitterData = twitter.twitter;
return {
accountInformation: {
title: "Account Information",
username: `@${twitterData.username}`,
description: twitterData.description,
location: twitterData.location,
},
metrics: [
{
title: "Followers",
description: twitterData.public_metrics.followers_count,
},
{
title: "Following",
description: twitterData.public_metrics.following_count,
},
{
title: "Tweets",
description: twitterData.public_metrics.tweet_count,
},
{
title: "Listed",
description: twitterData.public_metrics.listed_count,
},
],
};
};
export const normaliseYoutubeMetrics = (youtubeData) => {
return (
youtubeData.columnHeaders.map((column, index) => {
return {
title: camelCaseToSentenceCase(column.name),
description: youtubeData.rows[0][index],
};
}) || []
);
};
export const normaliseEstimatedMinutesWatched = (estimatedMinutes) => {
const labels =
estimatedMinutes.rows.map((row) => {
return row[0];
}) || [];
const data = estimatedMinutes.rows.map((row) => {
return `${row[1]}`;
});
return {
labels,
datasets: [
{
label: "Minutes Watched / Day",
data,
fill: true,
backgroundColor: "rgba(53, 162, 235, 0.5)",
borderColor: "rgb(53, 162, 235)",
},
],
};
};
export const normaliseEstimatedMinutesPerCountry = (
estimatedMinutesCountry
) => {
const labels =
estimatedMinutesCountry.rows.map((row) => {
return row[0];
}) || [];
const data = estimatedMinutesCountry.rows.map((row) => {
return `${row[1]}`;
});
return {
labels,
datasets: [
{
label: "Minutes Watched / Country",
data,
fill: true,
backgroundColor: "rgba(255, 99, 132, 0.5)",
},
],
};
};
const camelCaseToSentenceCase = (text) => {
const result = text.replace(/([A-Z])/g, " $1");
return result.charAt(0).toUpperCase() + result.slice(1);
};Step 5: Creating Twitter and Youtube components
Let's create our final two components required - Twitter and Youtube. We'll create a card shaped dashboard.
Create a
Create a
components directory, and add Twitter.js and Youtube.js inside their respective folders. Let's add code!!src/components/Twitter/Twitter.js
import React from "react";

import { Card, Elevation } from "@blueprintjs/core";
import { normaliseTwitterData } from "../../utils/normaliseData";

const Twitter = (twitter = {}) => {
  const twitterData = normaliseTwitterData(twitter);
  return (
    <div>
      <h5 style={{ fontSize: "large", textAlign: " left" }}>Twitter</h5>
      <div
        style={{
          display: "flex",
          flexWrap: "wrap",
          justifyContent: "space-between",
          gap: "10px",
        }}
      >
        <Card
          interactive={true}
          elevation={Elevation.TWO}
          style={{
            minWidth: "200px",
            minHeight: "200px",
            maxWidth: "500px",
          }}
        >
          <h5 style={{ fontSize: "large", color: "#394b59" }}>
            {twitterData.accountInformation.title}
          </h5>
          <div style={{ fontSize: "medium" }}>
            <p>{twitterData.accountInformation.username}</p>
            <p>{twitterData.accountInformation.description}</p>
            <p>{twitterData.accountInformation.location}</p>
          </div>
        </Card>
        {twitterData?.metrics.map((card) => {
          return (
            <Card
              interactive={true}
              elevation={Elevation.TWO}
              style={{
                minWidth: "200px",
                minHeight: "200px",
              }}
              key={card.title}
            >
              <h5 style={{ fontSize: "large", color: "#394b59" }}>
                {card.title}
              </h5>
              <p style={{ fontSize: "xx-large" }}>{card.description}</p>
            </Card>
          );
        })}
      </div>
    </div>
  );
};

export default Twitter;
src/components/Twitter/index.js
export { default } from "./Twitter.js";Similarly, adding to the youtube component.
src/components/Youtube/Youtube.js
import React from "react";

import { Card, Elevation } from "@blueprintjs/core";
import Chart from "chart.js/auto";
import { Line, Bar } from "react-chartjs-2";
import {
  normaliseYoutubeMetrics,
  normaliseEstimatedMinutesWatched,
  normaliseEstimatedMinutesPerCountry,
} from "../../utils/normaliseData";

const Youtube = ({
  youtubeMetrics = {},
  youtubeMinutesDay = {},
  youtubeMinutesCountry = {},
}) => {
  const youtubeData = normaliseYoutubeMetrics(youtubeMetrics);
  const estimatedMinutesWatched =
    normaliseEstimatedMinutesWatched(youtubeMinutesDay);
  const estimatedMinutesWatchedCountry = normaliseEstimatedMinutesPerCountry(
    youtubeMinutesCountry
  );
  return (
    <div>
      <h5 style={{ fontSize: "large", textAlign: " left" }}>Youtube</h5>
      <div
        style={{
          display: "flex",
          flexWrap: "wrap",
          justifyContent: "space-between",
          gap: "10px",
        }}
      >
        {youtubeData?.map((card) => {
          return (
            <Card
              interactive={true}
              elevation={Elevation.TWO}
              style={{
                minWidth: "200px",
                minHeight: "200px",
              }}
              key={card.title}
            >
              <h5 style={{ fontSize: "large", color: "#394b59" }}>
                {card.title}
              </h5>
              <p style={{ fontSize: "xx-large" }}>{card.description}</p>
            </Card>
          );
        })}
        <Line
          data={estimatedMinutesWatched}
          style={{ maxHeight: "60%", maxWidth: "47%", marginTop: "10px" }}
        />
        <Bar
          data={estimatedMinutesWatchedCountry}
          style={{ maxHeight: "60%", maxWidth: "47%", marginTop: "10px" }}
        />
      </div>
    </div>
  );
};

export default Youtube;
src/components/Youtube/index.js
export { default } from "./Youtube.js";Let's make a few changes to
App.js and add in the dummy data to get this all up and running!src/App.js
...

import Twitter from "./components/Twitter";
import Youtube from "./components/Youtube";

import { dummyData } from "./dummyData";

...

const App = () => {
  const { metric = {} } = dummyData;

  return (
    <div className="App">
      ...
      {/* Middle Container to hold our Metrics */}
      <div
        style={{ marginLeft: "30px", marginTop: "80px", marginRight: "30px" }}
      >
        <div style={{ marginTop: "50px" }}>
          <Youtube
            youtubeMetrics={metric.youtubeMetrics}
            youtubeMinutesDay={metric.youtubeMinutesDay}
            youtubeMinutesCountry={metric.youtubeMinutesCountry}
          ></Youtube>
        </div>
        <Divider style={{ marginTop: "50px" }}></Divider>
        <div style={{ marginTop: "50px" }}>
          <Twitter twitter={metric.twitter.data}></Twitter>
        </div>
        <Divider style={{ marginTop: "50px" }}></Divider>
      </div>
      {/* Footer */}
      ...
   ...
...
It should look like this

Step 6: Getting the backend APIs
Let's head to Canonic and clone this template to get started. It already has all of the setup required for youtube and twitter integrations. You can either:
Clone it, replace the Twitter & Youtube credentials with yours and hit Deploy 🚀 . This will then use your data from the services to fetch.
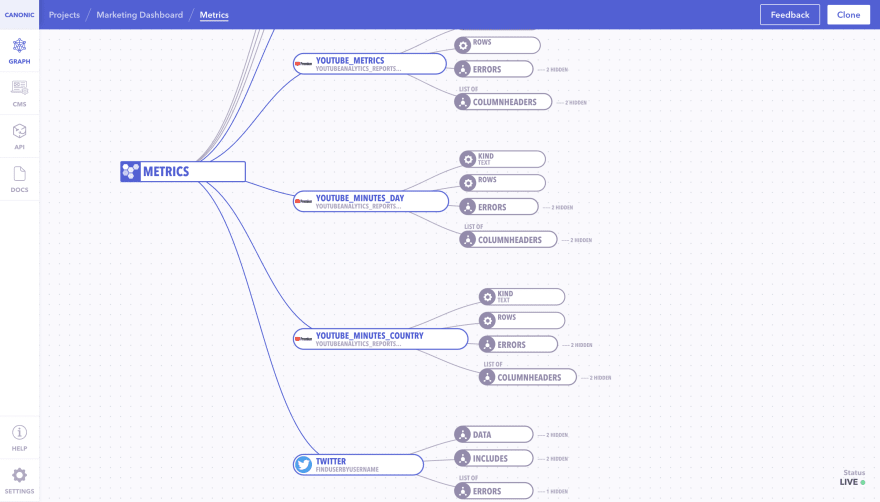
You can see the GraphQL API Endpoint in the Docs Section of your project
Step 7: Configuring GraphQL
We are using
ApolloClient to connect with our backend through GraphQL. Head to src/index.js and:ApolloClient
ApolloProvider
...
import { ApolloProvider, InMemoryCache, ApolloClient } from "@apollo/client";

/**
 * Connecting with the backend using apollo client
 */
const client = new ApolloClient({
  // Make sure you update the URI here to point to your backend
  uri: "https://marketing-dashboard.can.canonic.dev/graphql",
  cache: new InMemoryCache({
    addTypename: false,
  }),
});

ReactDOM.render(
  <React.StrictMode>
    <ApolloProvider client={client}>
      <App />
    </ApolloProvider>
  </React.StrictMode>,
  document.getElementById("root")
);
Replace the uri with your GraphQL API Endpoint if you cloned and deployed your own project.
Step 8: Configuring GraphQL queries to fetch data
After setting up our client and backend, you can always head to Docs tab to get more information about the API. It has a nice layout that lets you explore docs for your APIs.
Create a javascript file at
src/gql/query.js and add the following code.import { gql } from "@apollo/client";
/**
* gql query to get customers information
* The query parameters we got straight from Canonic autogenerated documentation
*/
export const GET_MARKETING_METRICS = gql`
query {
metric {
youtubeMetrics {
rows
columnHeaders {
columnType
dataType
name
}
}
youtubeMinutesDay {
rows
columnHeaders {
columnType
dataType
name
}
}
youtubeMinutesCountry {
rows
columnHeaders {
columnType
dataType
name
}
}
twitter {
data {
name
username
profile_image_url
location
description
public_metrics {
followers_count
following_count
tweet_count
listed_count
}
}
}
}
}
`;Step 9: Executing the query
Let's head to
App.js for one final time. We'll execute our API and pass the data to our components so that they can display the actual numbers. Since we've already setup the dummy data similar to our API response, this will be just like flipping a switch, and we'll be done.src/App.js
...
import { Navbar, Alignment, Divider, Spinner } from "@blueprintjs/core";

import { useQuery } from "@apollo/client";
import { GET_MARKETING_METRICS } from "./gql/query";

...

const App = () => {
  const { data = {}, loading } = useQuery(GET_MARKETING_METRICS);
  const { metric = {} } = data.metric ? data : dummyData;

  if (loading)
    return (
      <div style={{ margin: "200px" }}>
        <Spinner></Spinner>
      </div>
    );

  return (
    <div className="App">
      ...
    </div>
  );
};

export default App;
and Voila! We're done with the entire integration. Now if you run your project with
yarn start it should show like this:
Hope this guide helped you gain better insight about creating a dashboard that fetches data from Twitter and Youtube, how you can structure it, and how to quickly get a basic dashboard up and running. You can also check out our other guides here.
Join us on discord to discuss or share with our community. Write to us for any support requests at [email protected]. Check out our website to know more about Canonic.
24