
35
TIG Stack: Using Telegraf, InfluxDB and Grafana on Aiven

Performance monitoring is an essential aspect of every project, in both the digital and traditional world. Read on to find out how to use the TIG stack (Telegraf, InfluxDB, Grafana) to visualise the health status of your laptop.
Here's the overall process:
We'll create the whole monitoring pipeline in minutes with few commands in our terminal to report CPU metrics from a Mac. The stack we're using is this:
To create some test load on your system, please open your favourite random applications, or open 10+ browser tabs playing the greatest hits of the amazing Albano Carrisi (you'll thank me for this later ;))!
InfluxDB will be our metrics storage. Create an instance with the following Aiven's CLI command in our terminal:
avn service create --plan startup-4 \
  --service-type influxdb \
  --cloud google-europe-west3 \
  demo-influx
The above creates an InfluxDB instance (
-t influxdb) named demo-influx on Google's cloud region europe-west3 with a startup-4 plan. To review InfluxDB plans and associated cost, you can check the pricing page.With a similar command, create a Grafana instance, changing only the type of instance (
-t grafana) and the instance name (demo-grafana):avn service create --plan startup-4 \
--service-type grafana \
--cloud google-europe-west3 \
demo-grafanaThe last bit of setup needed on Aiven's side is the integration between Grafana and InfluxDB. Set it up with the following command:
avn service integration-create  \
  -t datasource                 \
  -s demo-grafana               \
  -d demo-influx
You already created a datasource in our
demo-grafana instance pointing to demo-influx. You're now ready to receive the metrics.brew install telegrafOnce Telegraf is installed, configure it to collect some metrics and push them to the
demo-influx instance. Get InfluxDB's service URI with the following command:avn service get demo-influx --format '{service_uri}'The service URI is in the form
https+influxdb://avnadmin:<PASSWORD>@<HOSTNAME>:<PORT>/defaultdb. Note down the <HOSTNAME>, <PORT> and <PASSWORD> parameters.Next, configure Telegraf by creating a file named
telegraf.conf with the following content:[global_tags]
[agent]
interval = "10s"
hostname = "Francesco.Mac"
[inputs.cpu]
totalcpu = true
[outputs.influxdb]
url = "https://<HOST>:<PORT>"
database = "defaultdb"
username = "avnadmin"
password = "<PASSWORD>"
precision = "10s"
skip_database_creation = trueHere you are creating a Telegraf agent that will report metrics over a 10 seconds interval, using the CPU Input Plugin to report the
The
totalcpu stats.The
[outputs.influxdb] plugin sends the collected metrics to the influxDB endpoint defined in the url parameter.Finally, you're setting
skip_database_creation = true, since the defaultdb database already exists in the instance.It's time to start Telegraf with the following command in the terminal:
telegraf -config telegraf.confIf no errors arise, you're now sending your CPU metrics to InfluxDB.
The data is now getting stored in the
demo-influx instance. We could query it via InfluxQL, but especially for time-series metrics, a line graph is usually much better for showing the current status and recent trend. Creating such visualisation in Grafana is achievable in few steps, with the first one being... understanding how to connect to Grafana itself.Retrieve the connection parameters with the following command in another terminal window:
avn service get demo-grafana --format '{service_uri_params}'The output is similar to the one shown below. It includes the Grafana hostname, port and the randomly generated password for the default
avnadmin user.{
"host": "<HOSTNAME>",
"password": "<PASSWORD>",
"port": "<PORT>",
"user": "avnadmin"
}Now open your browser to
https://<HOSTNAME>:<PORT> and use the avnadmin user and related <PASSWORD> to log in.Click Explore  and select the pre-created
and select the pre-created aiven-influxdb-demo-influx datasource that points to the previously created InfluxDB instance.Let's monitor the CPU usage by selecting the
cpu metric group in the FROM area. The metric we want to plot is the usage_user which we can select in the field() section. The settings should look like the below
Now click the Run Query button to visualise the
usage_user graph. The result should be similar to the following image, which is showing CPU usage consistently staying between 10% and 30% on my Mac.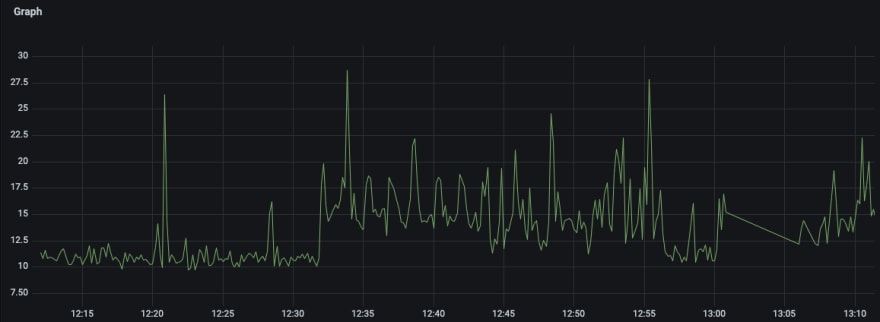
It's now time to change some settings:
 and select to display only the last 5 minutes of data.
10s as refresh interval.Now your graph should refresh every 10 seconds showing you the last 5 minutes dataset, like in the image below (speeded up).

Congrats, you just created your first monitoring pipeline!
This first visualisation uses only the basics of Grafana; should the next challenge be to create something more advanced or setup an alert? Up to you to define, in the meantime here are some resources you might find useful:
P.s. I hope you enjoyed Albano Carrisi!
35