
27
Part-2: A Beginner’s Practical Guide to Containerisation and Chaos Engineering with LitmusChaos 2.0
This blog is part two of a two blog series that details how to get started with containerization using Docker and Kubernetes for deployment, and later how to perform chaos engineering using LitmusChaos 2.0. Find Part-1 of the blog here.
Say you have deployed your E-Commerce application using Kubernetes and you’re very satisfied with how flexible and stable your application deployment has come to be. During the testing of the application, it had checked all the boxes and you’re very confident that your application deployment is all set to face the peak hours of the sale next week, which will have customers all over the country trying to buy products using your application. But alas, right on the peak hours of the sale, your customers face a service outage. What went wrong? You don’t have any idea, since on a superficial level nothing seems to be out of order. Could this infelicitous situation have been avoided? Yes, using chaos engineering.
In this blog, we will fundamentally explore chaos engineering; starting from what is chaos engineering, why chaos engineering is a necessity, how is it different from testing, processes, and principles of chaos engineering, introduction to cloud-native chaos engineering, a bird’s eye view of LitmusChaos, and finally, we will perform a pod-delete chaos experiment with a custom chaos workflow on the application that we had deployed in the previous blog.
As Wikipedia defines it:
Chaos engineering is the discipline of experimenting on a software system in production in order to build confidence in the system’s capability to withstand turbulent and unexpected conditions.
In our previous example of the E-Commerce application which faced a service downtime on account of the sharp rise in the number of users trying to simultaneously access the application, that situation could have been avoided by identifying the factors that were contributing to the service downtime.
Chaos Engineering emphasizes experiments, otherwise called hypotheses, and then compares the results to a defined steady-state. It is also regarded as the science of “breaking things on purpose” to identify the unforeseen weaknesses of the system before they wreak havoc in production. More than just fault injection, chaos engineering is an attempt at understanding the factors that contribute to the instability of a system, and gaining insights from the behavior of the system as a whole when it is subjugated to an adverse situation, with the ultimate goal of making systems more resilient in the production environment.
As an example, a distributed system could be checked for resiliency by randomly disabling the services responsible for the functioning of the system and analyzing its impact on the system as a whole.
Recognize the dangers and consequences: By allowing you to create an experiment and quantify how it affects your business, chaos engineering allows you to understand the influence of turbulent conditions on important applications. Companies can make informed judgments and react proactively to avoid or prevent losses when they understand what’s at risk.
Reaction to an incident: Because distributed systems are so complicated, there are several ways for things to go wrong. The notion of disaster recovery and business continuity is critical for firms in highly regulated contexts, such as the financial industry, because even a single instant of outage can be costly. These industries may rehearse, prepare, and put mechanisms in place for real-life situations by conducting chaotic experiments. When an incident occurs, chaos engineering allows teams to have the correct level of awareness, plans, and visibility.
Application Security & Observability: Chaos experiments help you figure out where your systems’ monitoring and observability capabilities are lacking, as well as your team’s ability to respond to crises. Chaos engineering will help you identify areas for improvement and motivate you to make your systems more visible, resulting in better telemetry data.
System Reliability: Chaos engineering enables firms to create dependable and fault-tolerant software systems while also increasing your team’s trust in them. The more reliable your systems are, the more confident you can be in their ability to perform as expected.
In one word, no.
A failure test looks at a single situation and determines whether or not a property is true. A test like this breaks the system in a predetermined way. The outcomes are often binary and do not reveal any additional information about the program, which is essential to understand the root cause of the problem.
Chaos Engineering’s purpose is to generate fresh information about the system when it is subjugated to adversity. One can learn more about the system’s behaviors, attributes, and performance because the scope is broader and the outcomes are unpredictable. Therefore it allows us to better understand the limitations of our system and act on them.
By and large, chaos engineering can be abstracted into the following set of processes:
Define the steady-state hypothesis: You should begin by imagining what could go wrong. Start with a failed injection and forecast what will happen when it’s live.
Confirm the steady-state and perform several realistic simulations: Test your system using real-world scenarios to observe how it reacts to different stressors and events.
Collect data and monitor dashboards: You must assess the system’s dependability and availability. It’s ideal to employ key performance indicators that are linked to consumer success or usage. We want to see how the failure compares to our hypothesis, therefore we’ll look at things like latency and requests per second.
Changes and issues should be addressed: After conducting an experiment, you should have a good notion of what is working and what needs to be changed. We can now predict what will cause an outage and precisely what will cause the system to fail.
An elaborate description of the same is the Principles of Chaos manifesto, which describes the core concerns that chaos engineering should address:
Understand your system’s normal state: Define your system’s steady state. Any chaotic experiment uses a system’s regular behavior as a reference point. You will have a better understanding of the effects of faults and failures if you understand the system when it is healthy.
Use of realistic bugs and failures: All experiments should be based on plausible and realistic settings. When a real-life failure is injected, it becomes clear which processes and technologies need to be upgraded.
Production-level testing: Only by running the test in a production setting can you see how disruptions influence the system. Allow your team to experiment in a development environment if they have little or no experience with chaotic testing. Once the production environment is ready, test it.
Control the radius of the blast: A chaotic test’s blast radius should always be kept as small as possible. Because these tests are conducted in a live setting, there is a potential that they will have an impact on end-users.
Automating chaos: Chaos experiments may be automated to the same degree as your CI/CD pipeline. Continuous chaos allows your team to continuously improve current and future systems.

Businesses love cloud: About a third of companies’ IT budget goes to cloud services and the global public cloud computing market is set to exceed $330 billion in 2021. The groundbreaking shift towards cloud-native software products needs to be supplemented with the right set of tools to ensure that they are resilient against all the possible adverse situations that may arise in production.
Enter cloud-native chaos engineering, the best of both worlds. In its core essence, it's all about performing chaos engineering in a cloud-native or Kubernetes-first way. There are four major principles that define how cloud-native a chaos engineering tool or framework is:
CRDs for Chaos Management: For coordinating chaos on Kubernetes, the framework should have explicitly defined CRDs. These CRDs provide standard APIs for provisioning and managing chaos in large-scale production systems. These are the elements that make up a chaotic workflow orchestration system.
Open Source: To enable larger community engagement and examination, the framework must be totally open-source under the Apache License 2.0. The number of applications that are migrating to the Kubernetes platform is uncountable. Only the Open Chaos model will thrive and gain the requisite adoption at such a wide scale.
Extensible and Pluggable: The framework should be integrable with the vast number of existing cloud-native applications, essentially built as a component that can be easily plugged in for chaos engineering within an application and can be easily plugged out as well.
Broad Community adoption: The chaos will be carried out against well-known infrastructures such as Kubernetes, applications such as databases, and infrastructure components like as storage and networking. These chaos experiments can be utilized again, and a large community can help identify and contribute to more high-value scenarios. As a result, a Chaos Engineering system should have a central hub or forge where open-source chaos experiments can be shared and code-based collaboration is possible.
LitmusChaos is a cloud-native Chaos Engineering framework for Kubernetes that fulfills all the four criteria listed above.

Litmus is a toolset to do cloud-native Chaos Engineering. It helps both Developers and SREs automate the chaos experiments at different stages within the DevOps pipeline like development, during CI/CD, & in production. Fixing the weaknesses leads to increased resilience of the system.
Litmus adopts a “Kubernetes-native” approach to define chaos intent in a declarative manner via custom resources. It broadly defines Kubernetes chaos experiments into two categories: application or pod-level chaos experiments and platform or infra-level chaos experiments. The former includes pod-delete, container-kill, pod-cpu-hog, pod-network-loss, etc., while the latter includes node-drain, disk-loss, node-cpu-hog, etc. It is largely developed under Apache License 2.0 license at the project level.
Before we understand the architecture of Litmus, let us understand a few terminologies:
Chaos Experiment: Chaos Experiments are the building blocks of the Litmus architecture. Users can develop the desired chaos workflow by choosing from freely available chaos experiments or by creating new ones.
Chaos Workflow: A chaos workflow is a lot more than a chaos experiment. It helps the user define the intended result, observe the result, analyze the overall system behavior, and decide whether the system needs to be changed to improve resilience. For a normal development or operations team, LitmusChaos provides the infrastructure required to design, use, and manage chaotic workflows. Litmus’ teaming and GitOps features considerably aid in the collaborative control of chaotic processes within teams or software organizations.

Litmus components can be classified into two parts:
Portal is a set of Litmus components that act as Cross-Cloud Chaos Control plane (WebUI) which is being used to orchestrate and observe the chaos workflows on Agents.
Agent is the set of Litmus components that induces Chaos using the chaos workflows on the K8s cluster component.
Litmus WebUI: Litmus UI provides a web user interface, where users can construct and observe the chaos workflow at ease. Also this act as a cross-cloud chaos control plane that is
Litmus Server: Litmus Server act as middleware which is used to handle API request from the user interface, store the config and results into the DB. This also acts as an interface to communicate between the requests and scheduling the workflow to Agent.
Litmus DB: Litmus DB act as a config store for chaos workflows and their results.
Chaos Operator: Chaos-Operator watches for the ChaosEngine CR and executes the Chaos-Experiments mentioned in the CR. Chaos-Operator is namespace scoped. By default, it runs in litmus namespace.
CRDs: During installation, the following three CRDs are installed on the Kubernetes cluster: chaosexperiments.litmuschaos.io, chaosengines.litmuschaos.io, and chaosresults.litmuschaos.io.
Chaos Experiment: Chaos Experiment is a CR and is available as YAML files on Chaos Hub.
Chaos Engine: ChaosEngine CR connects experiments to applications. The user must construct ChaosEngine YAML by giving the app label and experiments, as well as the CR.
Chaos Results: The results of a ChaosExperiment with a namespace scope are stored in the ChaosResult resource. The experiment itself creates or updates it in runtime. It contains critical information such as the ChaosEngine reference, Experiment State, Experiment Verdict (on completion), and key application/result properties. It can also be used to collect metrics.
Chaos Probes: Litmus probes are pluggable tests that can be defined for any chaotic experiment within the ChaosEngine. These checks are carried out by the experiment pods based on the mode they are defined in, and their success is used to determine the experiment’s judgment (along with the standard “in-built” checks).
Chaos Exporter: Metrics can be exported to a Prometheus database if desired. The Prometheus metrics endpoint is implemented by Chaos-Exporter.
Subscriber: Subscriber is a component on the Agent side that communicates with the Litmus Server component to obtain Chaos process data and return the results.
Let’s get a hang of Litmus with a very simple chaos experiment: the
pod-delete experiment. Essentially, we’d like to see that whether our Kubernetes deployment from the last blog is resilient against the event of accidental pod-deletion.Here’s what we’d do; firstly we will install Litmus, then we’d define our custom workflow, and finally we’d analyze the results of our experiment. Simple, isn’t it?
Our application deployment can be viewed using the
kubectl get deployments command:
and the associated pods can be viewed using
kubectl get pods: 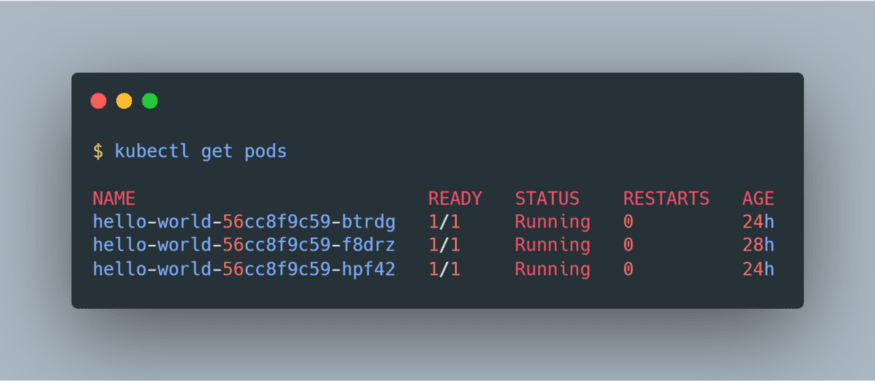
Before installing Litmus, let us check the pre-requisites:
Once we’re good with these, let’s follow the installation steps. Litmus can be installed either using Helm or using Kubectl. Let’s try to install it using Helm:
Litmus installs within the litmus namespace. So let us create the namespace with the command:
kubectl create namespace litmusClone the litmus repo and move into the cloned directory using the command:
git clone https://github.com/litmuschaos/litmus-helm && cd litmus-helmThe helm chart will install all the CRDs, required service account configuration, and chaos-operator required both for the core services as well as the portal to run. Use the command
helm install litmuschaos — namespace litmus ./charts/litmus-2–0–0-beta/And that’s it, you’re all set up to use Litmus! You can verify the installation by viewing all the resources installed under the
litmus namespace using kubectl get all -n litmus command:
It might take a while for all the resources to get ready and eventually you’d see something as depicted above. Here we can observe that we have three pods running:
litmus-frontend, litmus-backend, and mongo. These comprise the Litmus WebUI, Litmus Server, and Litmus DB respectively, as discussed earlier.We also have three services for our application, namely
litmusportal-frontend-service, litmusportal-backend-service, and mongo-service. These services maintain the endpoints for the pods which we saw earlier.These pods are created using the two deployments namely
litmusportal-frontend and litmusportal-backend, which are also responsible for specifying the replicasets for the same.Lastly, the Mongo DB database being a stateful resource uses a statefulset named
mongo to persist the data contained by the DB even if the mongo pod dies and restarts.Once all these resources are ready, we can proceed to the Litmus portal. For this, we will try to access the NodePort service
litmusportal-frontend-service. The nodePort assigned to the litmusportal-frontend-service in my machine has a mapping of 9091:30628 where 9091 is the specified targetPort while 30628 is the assigned nodePort.If you’re using Minikube, you can port-forward any unused port of your choice to the
litmusportal-frontend-service in order to access it at that port. For example, if I wish to access the litmusportal-frontend-service at the 3000 port, I’d use the command kubectl port-forward svc/litmusportal-frontend-service 3000:9091 -n litmus. Once done, simply access the Litmus portal at http://127.0.0.1:3000.If you’re using any other Kubernetes platform, you can directly access the Litmus portal at the
nodePort, given you have a firewall rule allowing ingress at that port. For example, I have a nodePort of 30628, hence I can directly access the Litmus portal at http://127.0.0.1:30628.
The default username is
admin and the default password is litmus. Once you log in, you’d be prompted to enter a new password. Once that’s done, you’d find yourself in the dashboard:
Let’s take a quick tour of the portal. The Dashboard is where you see the different workflows which were either currently executing or had been previously executing, the number of agents connected to the portal, and the number of projects and invitations for collaboration. Inside Workflows, you will be able to get an elaborate view of the running and past workflow, along with their respective analytics and logs. ChaosHubs is where you can access the chaos experiments, by default you can access all the experiments listed under the Litmus’ ChaosHub but you can also set it up with your own hub. Under Analytics you’d be able to get a vivid analysis of the different aspects of your chaos workflows, using the graphs. Finally, Settings allow you to modify your personal information, automate workflows using GitOps, etc.
Let’s proceed on with the workflow creation for our pod-delete experiment. In Dashboard, click on the Schedule a Workflow button and choose the self-agent, since the application we’re targetting is deployed within the same Kubernetes cluster.

Click Next. Select “Create a new workflow using the experiments from MyHub” and from the dropdown, choose “Chaos Hub”. This is because the experiment we’re trying to perform here i.e. the pod-delete experiment, is a part of the Chaos Hub and we can directly use it, without the need to define it ourselves.

Click Next. Under the Workflow Settings, rename your workflow to any name of your choice. Don’t alter the namespace since our Litmus installation is supposed to use the
litmus namespace only. Add a description of your own choice.
Click Next. Inside Tune Workflow, currently, you’d be able to view only one step listed in the flow chart and that is “install-chaos-experiments”.
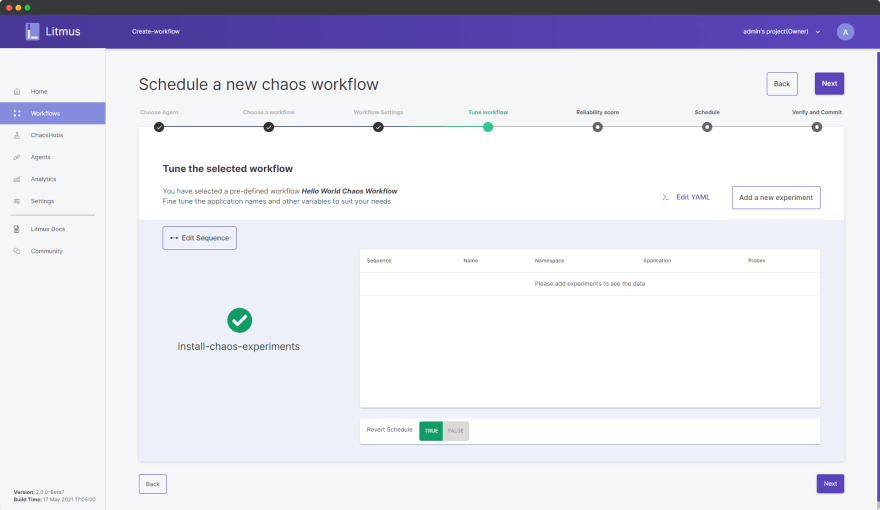
Click on Add a new experiment and choose generic/pod-delete.
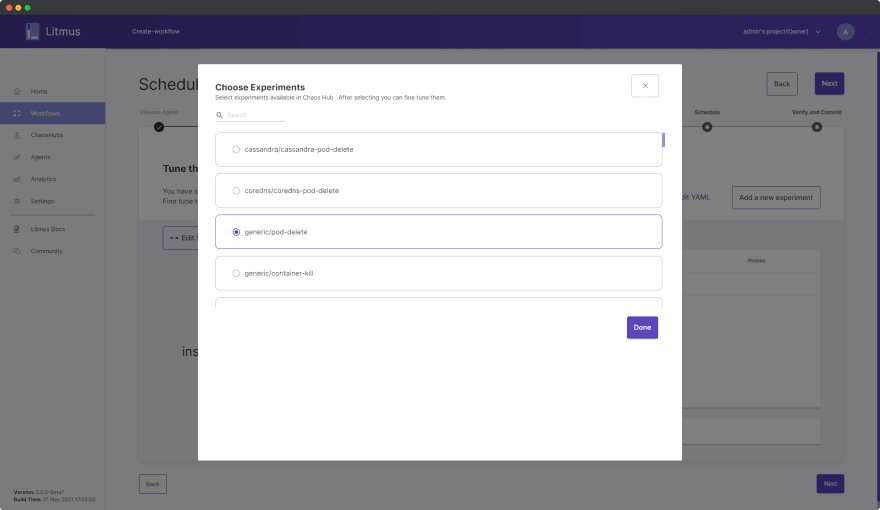
Click Done.
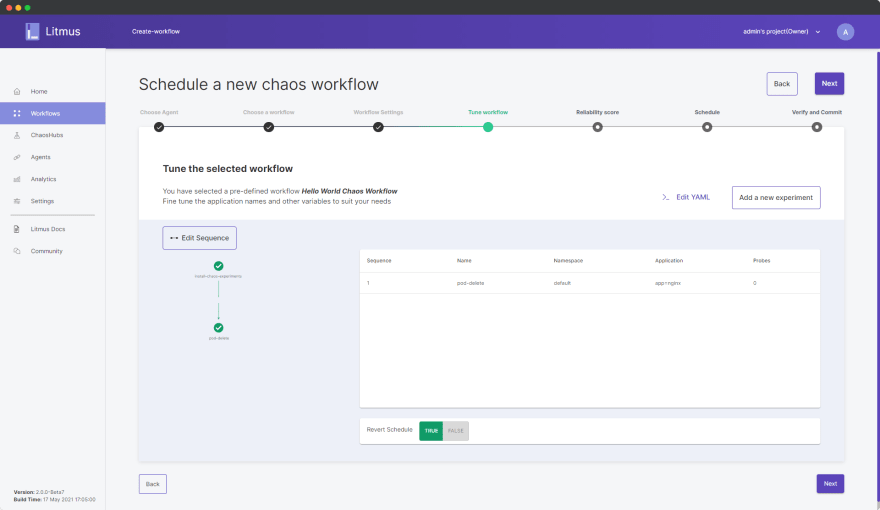
As you can observe, in the flow chart a second step “pod-delete” has been listed now. Although for the purpose of this demo we’d keep the workflow simple with only one experiment, one can design their entire workflow by adding more experiments as per the desired sequence. Its as simple as that!
Now, we’d specify the target deployment on which the chaos workflow will be executed. Click on Edit YAML and scroll down to line number 134 in the editor.

Here, we need to specify the
appLabel of our hello-world application by overriding the default app=nginx value. To check the label of our deployment, we can use the kubectl get deployments --show-labels command: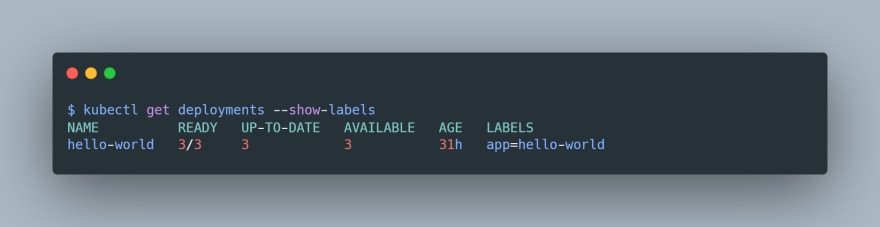
The label of our deployment is
app=hello-world so we’d simply replace app=nginx with app=hello-world.
Click Save Changes. Back in the portal, keep Revert Schedule as TRUE. This ensures that all the changes made to the system during the execution of the workflow will get reverted post-completion of the workflow. Click Next.
In Reliability Score, we can add a numeric score between 1 to 10 for each of our experiments. Litmus will simply use this weightage while calculating the resiliency score at the end of the workflow.

Click Next. Inside Schedule, we can schedule our workflows to be executed in a determined frequency or we can simply schedule it to execute right away. Choose “Schedule now”.

Click Next. Inside Verify and Commit, you can review your workflow details and make changes if required before finally executing the workflow.

Once you’re satisfied with the configuration, click Finish. You have successfully started the Chaos Workflow now:

Click Go to Worklow and choose the currently running workflow from the Workflows dashboard. You can view the graphical view of the workflow as it is actively performing the pod-delete experiment on our deployed application.
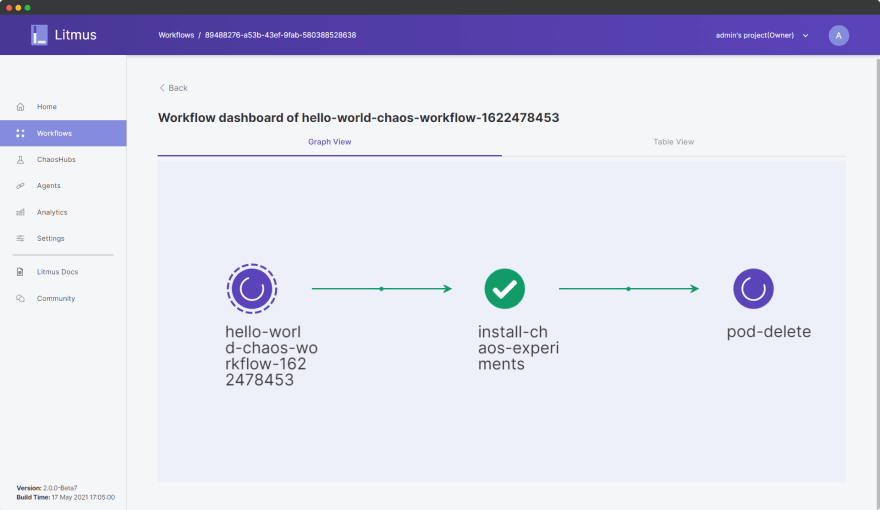
In effect, this experiment will first install the chaos experiment resources in the cluster, causing one of the three pods in our application deployment to be randomly chosen and deleted, and finally perform a cleanup of the chaos experiment resources.
The application deployment is therefore expected to spin up a new pod in replacement of the forcefully deleted pod for the experiment to be successful. Otherwise, if a new pod fails to spin up, then our system is definitely not resilient.
After a few minutes, you’d be able to see that the experiment has successfully completed:
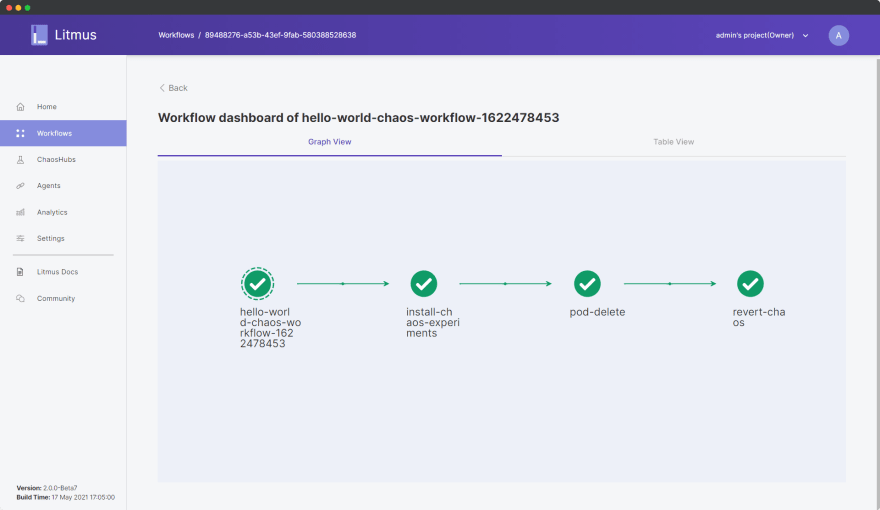
All the steps of the experiment were successful and our system was able to successfully cope up even in the scenario of forceful pod-delete. We can further analyze the details regarding the experiment inside the Table View:
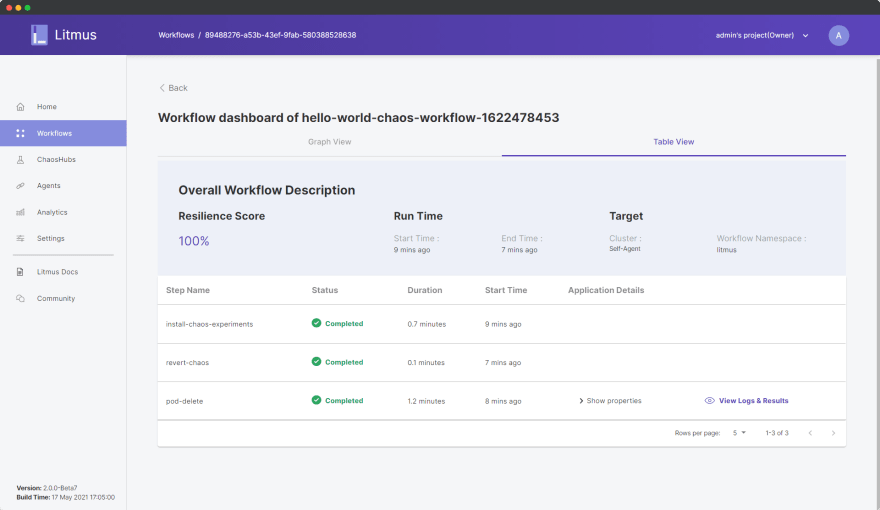
As we can see, we have obtained a 100% resilience score, and the other pieces of information of our experiment are also visible here. Furthermore, we can analyze the workflow analytics to better understand the impact of the workflow upon our system. Click Back and in the Workflow dashboard, click on the options ellipsis icon:
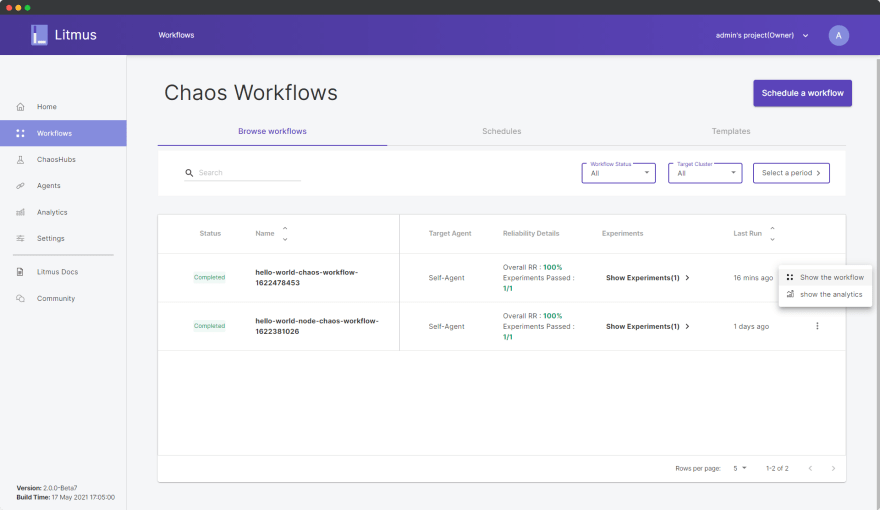
Choose Show the analytics.

The analytics graph shows the sequence of chaos experiments, the resiliency score, and the state of other parameters over the timeline of the execution of the workflow.
In conclusion of this blog series, let us appreciate that how we went all the way from containers to chaos engineering, starting from learning how to Dockerize a Node.js application, deploying our Docker container using Kubernetes, and finally using LitmusChaos to perform a pod-delete chaos experiment on our application.
Once again, welcome to the world of containers and chaos engineering. Come join me at the Litmus community to contribute your bit in developing chaos engineering for everyone. Stay updated on the latest Litmus trends through the Kubernetes Slack channel (Look for #litmus channel).
Don’t forget to share these resources with someone who you think might benefit from them. Thank you. 🙏
27